Every year, friend-of-the-site David Collum writes a detailed "Year in Review" synopsis full of keen perspective and plenty of wit. This year's is no exception. Moreover, he has graciously selected PeakProsperity.com as the site where it will be published in full. It's quite longer than our usual posts, but worth the time to read in full. A downloadable pdf of the full article is available at the bottom of the post -- cheers, Adam
Background
“Dear Cornell students, don’t learn economics from your chemistry professor.”
~ Matt Yglesias, Salon
Every December, I write a Year in Review or, as my wife calls it, my Urine Review.1,2,3,4 It has found a home at Chris Martenson’s website PeakProsperity.com5 with a secondary posting at Zerohedge,6 whose rabid followers crashed the server last year by clicking the crap out of it. What started years ago as a simple summary intended for a couple dozen wingnuts morphed over time into a much more detailed account that accrued upward of 100,000 clicks last year.
Owing to a complete lack of street cred, I’ve got to throw my elevator resume at you right here, right now. I’ve been quoted in the Wall Street Journal on the Flash Crash (no knowledge needed)7 and been interviewed by Lauren Lyster on Capital Accounts (Russia Today),8 Chris Martenson (Peak Prosperity),9,10 and James Howard Kunstler (Kunstlercast).11 I found my way into the Guardian this year commenting on the 2016 presidential race12 and The Macro Tourist Hour on BTFDtv.com just to rant.13 (I’m still waiting for Cosmopolitan to ask for comments about beauty products.) As this review is being uploaded, I am scheduled to do an interview with Erin Ade on Boom Bust (Russia Today), which should be uploaded concurrently on YouTube.14 This fall a bunch of Cornell undergraduates invited me to be a “distinguished lecturer” on economics not chemistry. Apparently, they don’t follow Matt Yglesias on Twitter. With that said, a gallant defense of my honor came by e-mail:
“I can think of no one better than you, Dave, to fill the void of an increasingly undistinguished profession of economists. They have excellent judgment at Cornell.”
~ Stephen Roach, Yale and former executive director at Morgan Stanley
Why would anybody give a damn what an organic chemist thinks about investing, economics, and politics?15 I’m baffled. As a half-hearted defense, in over 34 years of investing with a decidedly lopsided portfolio, I have had only two years in which my total wealth decreased in nominal dollars. My 14-year return since 01/01/00 is 9% compounded with no leverage and no glass eye. (We all made money in the 90’s so I don’t even go there.)
Each review begins with a highly personalized account of my efforts to get through another year of investing, which is followed by an overview of 34 years of investing. I thought maybe I would drop the former, but I couldn’t because one of my two losing years was this year. Come again? You lost money this year? Yep, I’m the guy—an urban legend in the flesh. You cannot teach this kind of prowess. It was a very expensive year to be in the Church of Austrian Economics and Hard Assets. Thus, I must continue with the personal overview as a form of a trip to the confessional. The investing section may be instructive for those interested in my approach and for gold bulls on suicide watch. The bulk of the review, however, describes thoughts and observations—the year’s events told as a narrative. The links are copious, albeit not comprehensive. Some are flagged as highly recommended.
I try to avoid themes covered amply in my previous reviews. I won’t pick on the Roth IRA anymore (although I was right),16 and I’ve left resource depletion alone (it’s still a problem). Nonetheless, some gifts just keep on giving. Debt permeates all levels of society, demanding comment every year. Precious metals are a personal favorite. This year seems to be more about politics and less about economics. Sections entitled Baptists, Bankers, the Federal Reserve, and Bootleggers describe the players involved in the biggest battle since Frodo melted down the ring for beer money. Society is juiced on easy money, leaving some of us breathless. I finish with a book list that shaped my thinking.
Every year I have declared with an increasingly shrill voice now inaudible even to dogs that civil liberties must be protected at all costs and that we all should avoid using “conspiracy” as a pejorative term. Oh...my...God! Just as smartphones have put to rest the existence of Yeti, aliens, and the Loch Ness Monster, 2013 put to rest any claim that conspiracies do not exist. If you denounce conspiracy theories and conspiracy theorists to me, I will remind you of the quote from a 20th century philosopher:
“Everybody has a plan until they get punched in the face.”
~ Mike Tyson
Contents
Footnotes appear as superscripts throughout this review; associated hyperlinks can be found here. The contents are as follows:
Part 1
- Background
- Investing
- The Bear Case
- The Economy
- Broken Markets
- Gold
- Debt and Retirement
- Municipal Debt
- Student Debt
- Bonds and Sovereign Debt
- Housing the Mortgage Markets
- Europe
- Cyprus
- Rest of the World
Part 2
- Confiscation
- The Fourth Estate
- CNBC–Rise Above
- Bankers and Finance
- Federal Reserve
- Bootleggers
- Paul Krugman
- Baptists
- Government Gone Wild
- Mr. Obama Goes to Washington
- Civil Liberties Part 1
- Civil Liberties Part 2: Edward Snowden versus the NSA
- Books
- Acknowledgements
- Links
Investing
“People only want to be contrarians when it’s popular.”
~ Rick Rule
I have changed almost nothing consequentially in my portfolio year over year. I still split my retirement contributions into cash and energy equities. Rebalancing was achieved primarily by the brutality of market forces:
12/31/12 12/31/13
Precious metals et al.: 52% 41%
Energy: 15% 21%
Cash equiv (short-term): 30% 34%
Other: 3% 4%
My portfolio was dragged underwater in January by the continuing bear market in precious metals and is now swimming with bottom feeders. In a relatively rare instance, but for the second year in a row, an overall return on investment of -17% was beat by the S&P 500 (22%) and Berkshire Hathaway (28%) in what was not a photo finish. (Stevie Cohen had a better year.) As a reminder, however, for the second year in a row, the majority of the return on the S&P was p/e expansion, and according to Forbes, “More than 100% of equity market gains since January 2009 have taken place during the weeks the Fed purchased Treasury bonds and mortgages.” We’ll return to this risk later.
My precious metals are distributed in approximately three equal portions to the gold-silver holding company Central Fund of Canada (CEF), Fidelity’s precious metal fund (FSAGX), and physical metals. The carnage is amply illustrated with a plot of GLD versus the S&P 500 (Figure 1). Unlike last year when significant metal gains offset losses in the equities, this year they all just tanked with negative returns in gold (–25%), silver (–33%) and precious metal-based equities (–50%). The metal-equity bear market continued unabated, baffling the hard-asset crowd. Did I overstay my welcome in the sector? It’s hard to say with my crystal ball in the shop, but the precious metal market was fascinating this year, and I remain a believer in the secular bull (albeit with white knuckles and wobbly knees; vide infra).
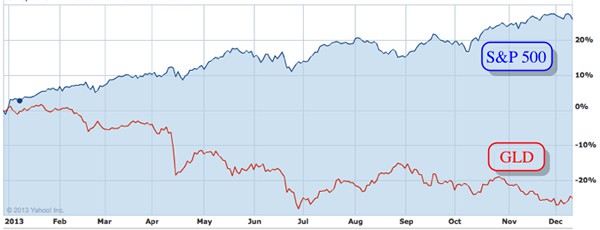
Figure 1. Precious metal-based indices GLD versus S&P.
A basket of Fidelity-based energy and materials funds afforded 14–24%. They are represented emblematically by the XLE spider (19%) and XNG Amex natural gas index (21%) in Figure 2. I am wildly bullish on natural gas for reasons discussed in detail three years ago.3 Not only have the equities become rather perky, but Fidelity finally fired a profoundly underperforming manager in its natural gas fund (FSNGX). I keep adding to an already chunky position. America’s fleet of trucks is starting to transition aggressively to natural gas; that’s illustrative of what may be a global shift toward natural gas that should reward patient investors.
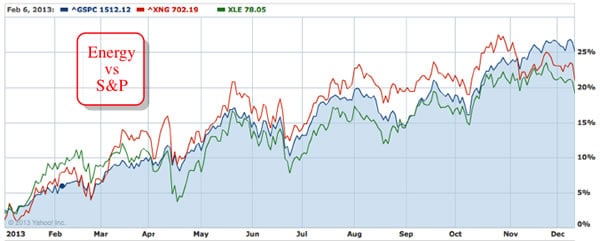
Figure 2. XLE (green) and XNG (red) versus S&P 500 (blue).
Cash was in a U.S. Treasury-backed money-market bunker returning the repressive rate of 0%. To say I am pissed off at the Fed for rendering my hard-earned and diligently saved capital worthless in the open markets because they are providing capital in unlimited quantities would be a grotesque understatement. I don’t have enough venom to heap on the Fed. I could care less what risky horsemeat Bernanke wishes I would buy, more people have been killed reaching for yield than at the point of a gun. Bonds will eventually become the story. Those who are pair trading—long bonds/short brains—will be carried away on boards.
I care deeply at a personal and moral level about my family’s savings rate. It was difficult to assess this year because I went longer real estate with the purchase of a new house (Figure 3) further confounded by some one-off gains. (I’ve invited everybody on Twitter to party on the lake this spring.) If we back out the “items”, even with the last full calendar year of college tuition—spike ball, end zone dance—we were on track to save approximately 22% of my gross income, which compares with a troubling 11% in 2012 and 20–30% in typical years.

Figure 3. View from the new digs.
To understand my lifetime returns, you must understand two unusual premises that have dominated my thoughts and actions. First, you’ve got to be a true believer to resist being shaken out of good investments or suckered into bad ones. You can sell good investments too soon. There are no guarantees out there (for retail investors). My second premise is that you have to get it right only about once a decade. Only time will tell if I over stayed my welcome in the precious metals and missed the beginnings of a secular bull in the S&P 500.
My variant of such a sequential trek via imbalanced portfolios changed in decadal rhythms as follows:
1980–88: exclusively bonds (100%)
1988–99: classic 60:40 equities:bonds
1999–2001: cash, precious metals, shorts (minor)
2001–2013: cash, precious metals, energy, tobacco (minor)
My total wealth accumulated through a combination of savings and investment as shown in Figure 4 (redacted dollar amounts.) The years 2008 and 2013 were the only two down years. Berkshire has dropped five years since 1991. A 9% compounded annual wealth accrual beginning 01/01/00 compares favorably to an annualized return on the S&P of 1.4% (ex-dividends) and on Berkshire of 8%.
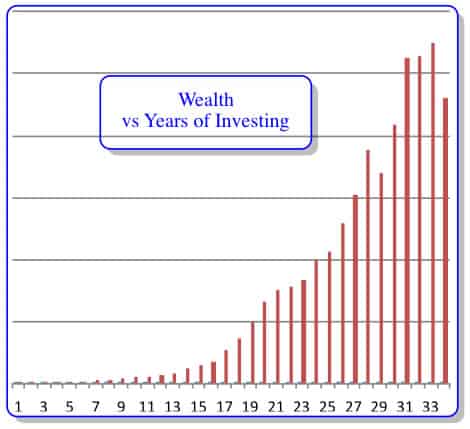
Figure 4. Total wealth accumulated (ex-housing) versus year of employment. Absolute dollar values have been omitted.
To clarify the origins of a 14-year return of 9% per year I offer Figure 5. By plunging into the precious metal and energy sector early and avoiding all other forms of investments (S&P in particular), I was able to capture the entire hard-asset bull market as well as an ensuing cyclical (or secular) bear.
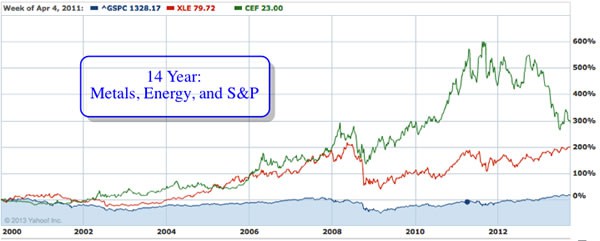
Figure 5. 14-year return on S&P (blue), gold/silver (CEF; green), and energy (XLE; red).
Thinking About Capitalism: The Great Deformation
Given 2013’s special role for me as the only grinding bear market I’ve ever experienced, I will take it right to the hoop by presenting my case for an ongoing secular bear market in equities, bonds, and many other investments that may go on for a decade or more. I will present the case for a secular bull market in gold a bit later. Before doing so, let me do just a little more soul searching.
I suspect that previous readers of my annual reviews may notice a distinct change in tone this year; I certainly do. Despite my best efforts to compartmentalize the issues that are central to defining 2013, the lines seem to be blurring. Are Broken Markets the result of The Federal Reserve? Is Government Corruption eroding Civil Liberties?
I am witnessing what David Stockman calls The Great Deformation, but are these distortions in the global capital markets inflicted by seemingly horrendous monetary policies or in my perceptions? I’ve pondered this question for years, but I don’t have a definitive answer. I believe that readers who finish the review will develop a sense of foreboding—the sense that something is lurking below the placid surface. I didn’t plan to “penetrate deeper and deeper into the Heart of Darkness”, but it happened nonetheless.
The Bear Case
“I feel sorry for [the bears] because they are simply living in the dark ages of monetary policy theory. They are stuck thinking like witch doctors rather than modern medical doctors.”
~ David Zervos, Jefferies economist
“By 2030, our calculations suggest that the real value of equities will be about 20% higher than in 2010....We do see it as something of a headwind...”
~ San Francisco Federal Reserve
As the equity markets were juiced higher and the equity bears became the walking dead, it is obvious why I don’t short stocks. But why am I still a secular bear? Of course, there are always things that go bump in the night. Some may prove inconsequential bricks in the wall of worry. I will do plenty of bricklaying throughout this document. However, some really big concerns—the monsters under my bed—keep me up at night.
Bonds and Buffett
In 1977, Buffett noted that “It is no longer a secret that stocks, like bonds, do poorly in an inflationary environment.” The quibbling over whether inflation is here continues, but there is little doubt that the hooligans at the Fed are determined to trigger some. The 32-year-old bond bull is long in the tooth, fully priced for an inflation-free world. We have central bankers on a bond buying spree that has the surreal effect of keeping interest rates low by printing money. Of course, these shenanigans will end, and price discovery in bonds will be accompanied by investors’ self-discovery. Optimists bray that rising rates are bullish, a sign that the world economy is recovering. In 1999, however, Buffett wrote a compelling article in Fortune attributing secular equity moves to one and only one parameter—the direction of long-term interest rates. Secular equity bull markets occur when long-term rates are dropping—not low but dropping—and secular bears occur when rates are rising.17 He didn’t equivocate. I could imagine him uttering some platitudinous gibberish like, “rising rates sink all boats.” When experts say that low rates are bullish they are either doofuses or Buffett has lost it. Buffett is a mafia don walking around in a bathrobe trying to look harmless, but I doubt he has lost it.
So are rates really that low? In a word, yes. I talk about that in the Bonds section. The salad days of the bond market are in our rear-view mirror. The rate bottom and subsequent rise will be global. Rising rates will spread into the markets and economy at large, causing concurrent stagnation, dropping price earnings ratios (from nosebleed Case–Shiller estimates of 24), collapse of credit-fueled/capex-lite corporate profit margins, and crush under-funded pensions and municipalities rendering them less funded. If rates have nowhere to go but up, what direction are they headed? Thought so. That is the generic monster under my bed.
Demographics and Unfunded Liabilities
The really nasty monster is a Frankenstein-like beast constituted by combining demographics and unfunded liabilities. We can watch demographics play out in living color in Japan. Japan’s 24-year-old lost decade is often attributed to inadequate intervention by central bankers and policy makers insufficiently armed with untested theories of academic economists mired in state capitalism. The Japanese have also been getting old. My Cornell colleague Rich Marin, former CEO of Bear Stearns Asset Management and author of the newly released Global Pension Crisis,18 estimates that Japan will demographically bottom out with one worker for every three retirees. You can fiddle with dollars, cents, yen, GDP, JGBs and savings estimates all you want, but the demonetized reality is that Japan will have one worker providing all the goods and services for four people. Kyle Bass is right: the Japanese economy is rotting from within.19,20
Well that’s gonna suck, but why do I care? That’s simple: we’re a decade or two behind Japan but making up ground fast. We’ve promised boomers a butt boat load (spouse edit) of benefits in their old age. Kotlikoff, Burns, and Smetters,21 in cahoots with Secretary of the Treasury Paul O’Neill, set out to wrap their brains around the unfunded liabilities—promises made which, after subtracting reasonable estimates of revenue streams, we haven’t a clue how we will cover. Kotlikoff now estimates that they total $205 trillion.22
Some readers have heard this number, but precious few can grasp it. $205 trillion? Let me do another demonetization. Assuming that there are 100 million taxpayers to pick up this tab and that the average taxpayer contributes 50% of their $50,000 per year salary—a preposterous payment schedule—how long will it take to pay off these liabilities? The answer is...wait for it...80 years...80 friggin’ years...8 decades...four score...8.0x101 birthdays...a lifetime. Maybe Kotlikoff had an Excel fail; there’s been a lot of that lately. I think he’s great, but he is an economist. I’ve seen estimates as low as $70 trillion. That cuts the burden on taxpayers living on half-salary to a mere 25 years. As Marin said in a recent seminar focusing only on the pension component of the problem, “I am trying desperately not to be apocalyptic.” Good luck with that one Cheech. Now would be a good time to panic.
The Economy
1%: “Our economy is doing very well.”
99%: “We’re very happy for you.”
Nothing is more difficult than teasing economic facts from the fiction being marketed daily. Dow watchers would claim we are at all time highs and, because markets are “forward looking,” we must be doing well. Others would call that a total crock. Even the most optimistic must admit that those down the food chain are less enamored with our current recovery. This section will necessarily have a left-wing, Elizabeth Warren feel to it. I don’t think she is a wealth redistributor, and I know that I am not because I (still) have some to distribute. However, a healthy economy probably distributes wealth in a rational (possibly even predictable) fashion, and I very much doubt we are observing that now. History shows that dismissiveness directed at expanding impoverished masses can have dire consequences. The 1% who suggest that the 99% “eat cake” are likely to eat it metaphorically. I don’t recommend we redistribute wealth, but we should be deeply concerned about how it is distributing as a possible symptom of a failing state. Some of the symptoms are mentioned in this section. Debt gets its own sections.
Corporations
To start with some good news, corporate balance sheets are said to be in unbelievable shape. I find this perplexing given that my arithmetic shows the Dow 30 is $500 billion in the hole (cash minus debt). Maybe I am missing other financial assets, but I wonder whether the balance sheets are filled with borrowed money. We are also told with considerable glee that corporate profit margins are breaking all-time records (Figure 6), possibly up to 70% above the historical averages.23 This, unfortunately, is very bad news because profit margins are notoriously mean regressing. Picture a 70% mean regression. Now picture the inevitable and mandated overshoot (or it wouldn’t be the mean). Profit margins are propped up by cheap capital courtesy of the Fed, lower numbers of employed workers (euphemistically called increased efficiency), savings from increasing numbers of benefit-free, part-time workers, and a total lack of wage pressure by those fully employed. Corporate capital expenditure (capex) is near zero,24 supposedly to fund dividend payments (although fungibility of money makes that connection dubious). Regardless of motivation, cutting back on capex is eating your seed corn. At some point the pipeline of innovation runs dry. I was struck by the news that Merck faces pressure from generic drug companies. Their response? Buy back shares.25 My head hurts. Corporate profit margins will naturally shrink. If workers begin to enforce some wage inflation into the equation, the regression of profit margins through the mean could be dramatic. The margins will collapse like a dream sequence in Inception as the fruits of research and development will not exist.
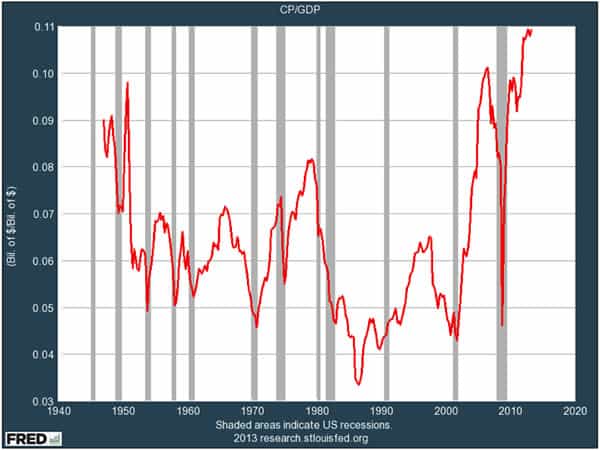
Figure 6. Corporate profit margins
“Facts do not cease to exist because they are ignored.”
~ Aldous Huxley
Employment
Few stats are more cooked than the employment numbers from Bureau of Labor Statistics (BLS). The former head of the BLS estimates that the reported unemployment numbers are about 3% higher than the reported estimates.26 This year they got really creative by “forgetting” to include California’s numbers five months in a row.27 Some estimates exceed 20%.28 The departure of workers from the workforce, whether voluntarily or by discouragement, often greatly exceeds the number of new jobs; the participation rate is not a pretty picture (Figure 7),29 but it may be more instructive with which to view unemployment. As a reminder, each percentage point on the y axis in Figure 7 represents approximately 2 million workers no longer employed or seeking work. The labor participation rate is deceptive in that it suggests we were here pre-1980, and our world continued to rotate on its axis (albeit with serious stagflation). However, any further drop begins to dig into the gains made by women entering the workforce in droves. That distant era only worked well because men were paid enough to raise a family on a single income, most had full-time rather than part-time employment, and college grads weren’t doing jobs requiring name tags. Figure 7 also does not include the boomers exiting the work force en masse; that is just beginning this year. Of course, we are assured they will work till they drop (or are released in a corporate downsizing to increase productivity).
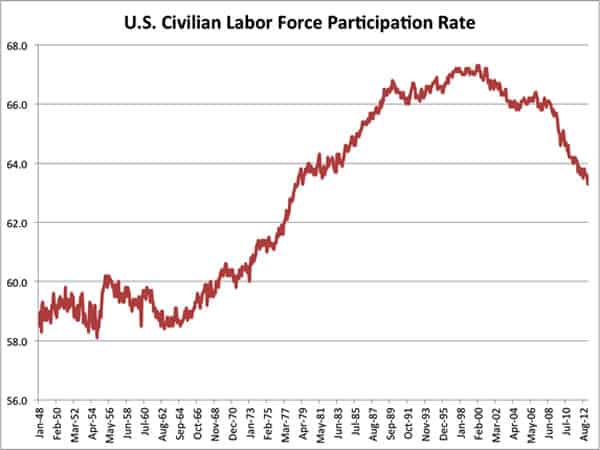
Figure 7. Long-term labor participation rate.
The raw emplo
This is a companion discussion topic for the original entry at https://peakprosperity.com/2013-year-in-review/