Peak Prosperity Publishing Note: These are the Finance related sections of Dave Collum’s Year in Review (exactly as it appears in the full review). We are posting this as a means to have a conversation in the comments on this portion of Dave’s Year in Review. We will post one section per day for the holiday week, each with it’s own comment section.
The full Year in Review can be found HERE.
Investing
Dave Collum is easily the best single investor I have come across.1–Bob Moriarty
Well, that was nice. I live on Cayuga Lake in a house that is a lifestyle changer, but it is threefold more expensive than I needed, which forces me to call it a real estate play. I use Zillow to track it on my balance sheet. Cash in TIAA and other short-term bonds are returning about 3.5%. I also have 15% of my wealth in a fund that is not under my control (white privilege from my parents) and is an old-man 40–60 equity-bond split. It got beat up last year reaching for yield; it was OK this year. Some selected risk assets held during 2023 are below, many of which are relatively new and rather speculative. I also have some other tobacco and energy stocks that I have owned for years.
- Fidelity Select Gold Portfolio (FSAGX): –2%
- Fidelity Natural Resources Fund (FNARX): +5%
- Fidelity Select Energy Portfolio (FSENX): +0%
- Goehring & Rozencwajg Resources (GRHIX): +12%
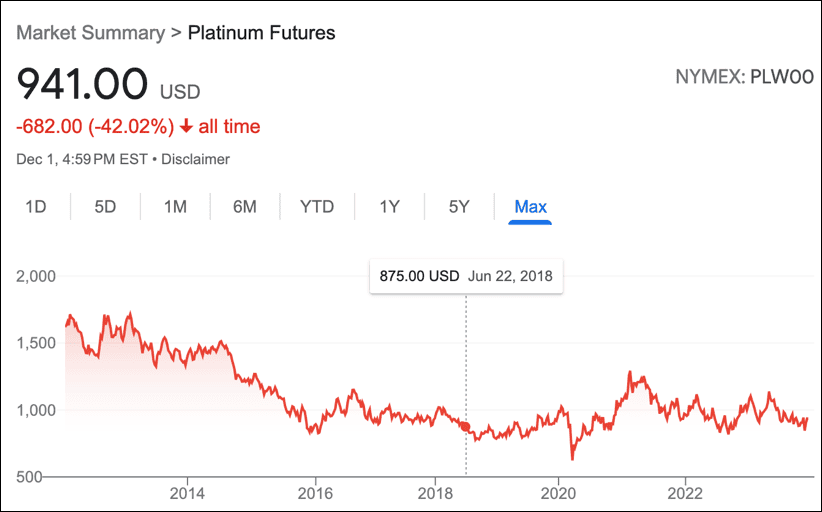
- Impala Platinum (IMPUY): –45%
- Jaguar Mining (JAGGF): –22%
- Palm Valley Capital Fund (PVCMX): +9%
- Rio Tinto (RIO): +5%
- Sibanye Stillwater Limited (SBSW): –39%
- Sprott Physical Silver Trust (PSLV): +4%
- Central Fund of Canada +3%
- Gold +13%
- Silver +4%
- PRPH –45%
- WDOFF +19%
- EWZ +34%
I am still interested in the platinum miners. PRPH is a speculative biotech play supported with wild enthusiasm by a friend with serious skin in the game. I am infatuated with Rio Tinto as a broadly based materials play. The EWZ is a Brazillian/BRICs bet inspired by Tavi Costa.
It is equally beyond doubt, that every speculative mania which has run its course of folly and disaster in this country has derived its original impulse from cheap money.~ The Economist, 1858
I did well—spectacularly, actually—in the 30 years spanning 1980–2009. My huge mistake was that I was positive the orderly swan dive in ‘08–’09 was a head fake and that there was much more damage to be done; I expected another halving. When the markets hit the lows that were modestly below historical fair value—I talk about this more below—and I was nearly 80% liquid, I should have asked a simple question: how much exposure to equities should I have at the current valuations? Markets are like Father Guido Sarducci’s a-comin’ and a-goin’ planet: you know where you are but not where you are headed. My current positioning is probably my last big call in investing. I am still very liquid. My portfolio has been the polar opposite of the S&P on many days this year, which pleases me because I am trying to position against the S&P. Since I am predicting the markets will get interesting in a catastrophic sort of way as discussed in subsequent sections, it is not the time to re-pot myself.

On one final note, I think you save for the future and invest to beat inflation. I take pride when my saving soars. I had some big expenses this year, including buying my wife a new car, repairing the old car to give to my son, installing an osprey nest in the lake right off my deck to make my wife as happy as possible, putting in some French drains, and contributing 5-digit sums from the Bank of Dad to each kid to make their lives a little easier. I still managed to save 25% of my gross annual salary this year. I am not living paycheck-to-paycheck, because I am paid well—academics at elite schools can be well-compensated provided they put up some good numbers—and I try to live a simple existence. Read the Millionaire Next Door; it’s about the psychology of saving.
The Fed has never attempted a dive of this degree of difficulty.~ Bill Fleckenstein
Gold and the Precious Metals
We're at this point in time where we don't have any road left to kick the can on our mismanagement of finances and monetary policy…the dollar will collapse under the weight of the deficit. I think gold is a good long-term hold, gold and other real assets with true value, such as land, gold and collectibles.1~ Jeff Gundlach
Gold started at $1830 jumped to a new all-time high of $2050 before getting monkey hammered to $1850. Short sellers who showed up in early December, however, got pegged when Powell spotted something that scared the hell out of him and announced rate cuts were coming. (Rumors of a failing Japanese bank are swirling as I type.) Gold is sitting at +12% ytd, but the price volatility could put this number out of date pronto. Silver hit a new decade high and shared the same playbook, albeit with a uninspired +11% year-to-date gain. The equities, despite good fundamentals on an absolute value (cash flow, strong balance sheets, low valuations) without invoking bullshit fictional reserve buried deep some God-forsaken regions of the world, managed a disappointing 2% despite gold’s rise. If you spot a tweet about me buying more gold equities, please send me some hate mail.
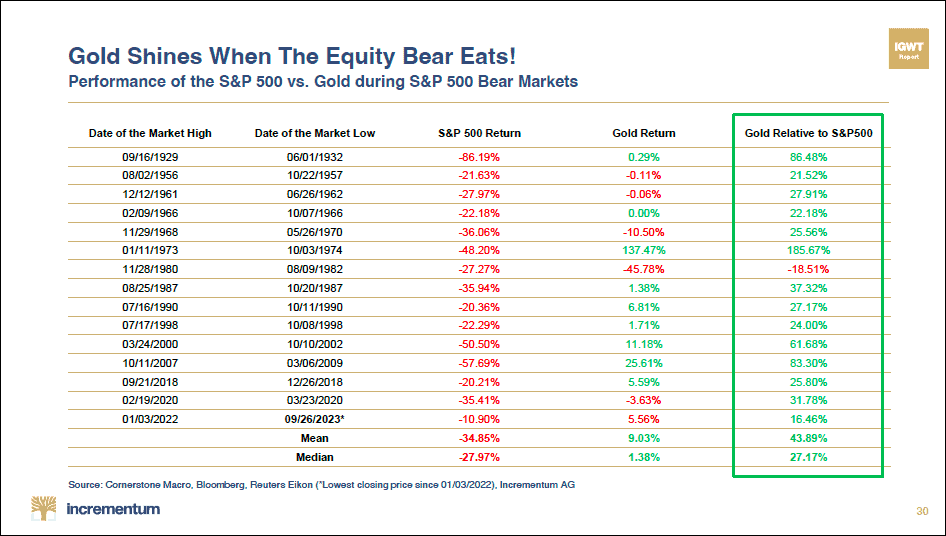
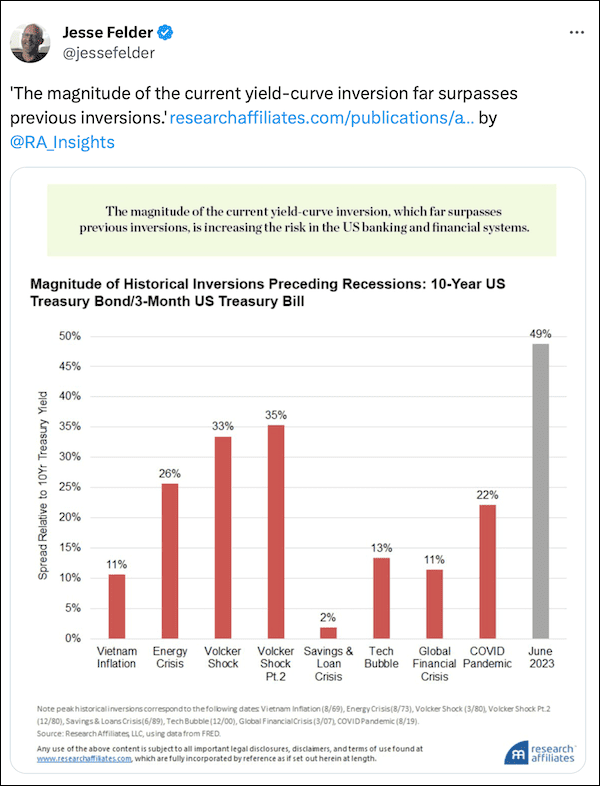
Given that the dollar’s surge against most currencies, metal investors ought to be pleased that they have not gotten scalped. This is all pre-game noise, however. We will discover the metals’ mettle when we get dragged into the next serious economic and market downturn. I was confident that Powell was looking more like Paul Volcker than Arthur Burns, he did an abrupt 180 December. Although the metals might surge, that Powell’s skittishness foreshadows something lurking in the pipes of the banking system. I always worry that the metals may track the S&P down if liquidity tightens. I wouldn’t look for historical precedents: every downturn has unique idiosyncrasies. I am optimistic because there were quite a few days when the metals correlated inversely with the S&P. The following chart from Incrementum supports the case for metals outperforming the S&P during hard times.
The following plot shows gold whoops equities after a yield curve inversion:
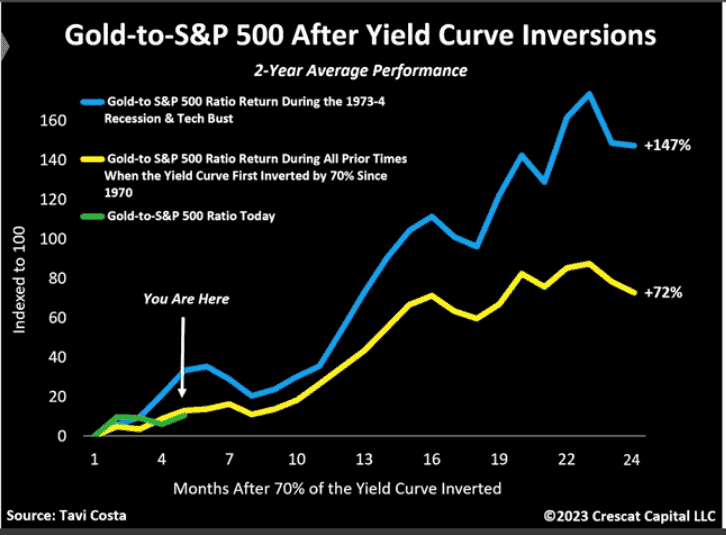
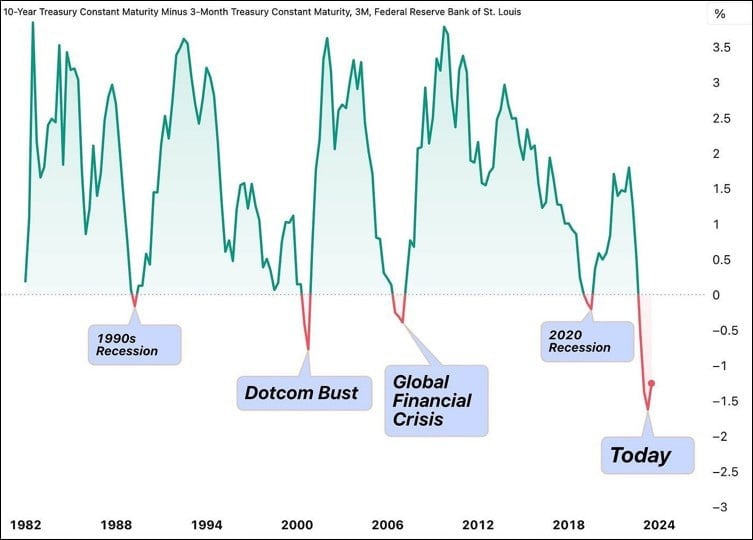
Well, the yield curve inverted starting in mid-2022. The current inversion is both persistent and the steepest of all time. History also shows that risk assets’ luge ride to the downside begins in earnest when the curve un-inverts.
Here are a few nuggets to ponder.
- Zimbabwe issued a gold-backed currency, and the IMF got their underwear in a bunch. We’ll have none of that.2
- Total global silver demand in 2022 came in at a record $1.242 billion ounces.3 This represented an 18% increase in silver demand over 2021.4 It is unclear how demand and supply aren’t the same numbers by definition.
- It looks like Mexico is clamping down on existing mining operations by shortening their permits (rights) by decades, adding a 5% surcharge on profits, and restricting water use.5
- In the first six months of 2023, China’s central bank bought an estimated 353 tons.6 China’s official gold reserves reached 5,029 tons by the end of June 2023. Some pundits are coming in with numbers 10 times that.
Meanwhile, the platinum miners (SBSW, IMPUY, and ANGPY) are priced like escorts in the San Francisco’s Tenderloin District. A disastrous mine problem at SBSW didn’t exactly help the sentiment or the price, forcing it to chop jobs and issue convertible shares.8 I spent a couple of days with a huge consumer of these shares who lives up near our cabin in the Adirondacks and am convinced that patience and the fat-assed 6–8% dividends (provided they hold up) pay you to be patient. Imagine what those shares would do if EVs lost their luster, hydrogen fuel cells became The New Thing, or platinum attained “meme” status after years of dormancy.
For a US investor, it hasn’t worked for an awfully long time. For many investors, it hasn’t worked in their professional careers...investors have limted capacity to take pain and lack the energy to defend a concept that’s underperformed for decades.9~ Cliff Asness (@CliffordAsness), founder of AQR Capital, talking about another asset class but…
Broken Markets
Now is a good time to buy or sell something that will generate me a fee or commission.~ @RudyHavenstein, 2016
You’ve gotta wonder what happened to that recession we were promised if Powell hiked rates to 3%. Was that just 14 days to flatten the curve or have markets done their endzone dance prematurely? Maybe this hysteresis is like March 2007, and that freight train is still just a low rumble off in the distance. The markets haven’t cracked, and the sell-side bookies wouldn’t know if the markets were about to star in Wall Street Chainsaw Massacre. Barron’s couldn’t even see it in December 2007, proclaiming “A Bullish Call: Wall Street’s seers forecast more gains for stocks next year.” Some of the uber-bears like Grantham, Hussman, and Felder assure us the end is nigh, possibly cutting well below the halfway mark (S&P sub-2000).
When you get into a bear market, the bottom is not just back to normal. If you’ve been far above normal, then the bear market carries you far below normal.~ Sir John Templeton in October 2001
The QQQs are up >40% year to date, which I suspect does not reflect a 40% growth in their capacity to create wealth. These markets are a Tinder/Grinder dating app run by MarketsGPT. This does not matter to me because, although my biological clock is ticking, my investment time horizon still stretches out years if not decades. I believe you should marry an investment to withstand the ebbs and flows en route to sustainable winners. You dump the wretch when the prospects for sustainable gains become bleak. I’ve never understood taking profits just for the sake of retrieving your initial investment unless there is something more appealing to invest in. I divorced my equities in ’99 and married gold and cash. My bug compatriots urged me to sell with both hands after gold launched above $300. I didn’t because I was married to it.
Technical Events. The geezers may have noticed that the language of Wall Street has mutated into nearly 100% technical lingo in which volatility, momentum, liquidity, sentiment, stock splits, support, resistance, Fibonacci numbers, various arbitrarily chosen moving averages, announced share buybacks, some Fed governor made a farting noise with his armpit, and, the dumbest of them all, cash on the sidelines are spewed by meatheads on CNBC. Interest rates are still quite low by historical standards and very low if they would stop lying about inflation. Tina—There is no alternative, an allusion to an equities-only portfolio strategy that seems to have drawn the affection of all the boys in town—appears to be on maternity leave with rates creeping to lordly 5%. She was quite the partier, but the slut’s absence hasn’t yet been noticed by equity markets.
Investors can’t get enough of Japan[ese] firms’ stock splits, which make shares more affordable. And many of those firms are beating the benchmark Topix index.~ Bloomberg, hyping stock splits, apparently after treatment with an MIB neuralyzer
I will eventually attempt to peer way over the horizon. I’m obliged, however, as part of a Year in Review to hit a few admittedly random events to satisfy the ADHD crowd.
- Steph Pomboy says Indiana University economists’ S&P earnings “fraud indicators” are at 50-year highs.1
- BlackRock CEO Larry Fink is backing away from his "ESG" scam, blaming it on QAnon leader Ron DeSantis.2
- Simon Hunt predicts the S&P will bounce off “support” at 3000 before crashing hard into a depression as interest rates soar into double digits.3
- The yield curve became the most inverted in almost four decades. Astute market watchers note that the whiplash back to normal is when the projectile vomiting commences.
All bull markets run out of money.4~ Walter Deemer, 1972
- Jesse Felder reminds us that market breadth—the percentage of stocks contributing to climbing the Wall of Worry—is the narrowest since 1990.5 “Excess liquidity” is a negative 11%. Tavi Costa notes that seeing tech stocks surging while the rest of he market declines has always foreshadowed major bear markets, such as seen in vicious countertrend rallies during the Dotcom Bust.”6
- Tom McClellan has noted, “In the entire published history of monetary aggregates (since 1959), there has never been an M2 drop as big as what we are experiencing,” suggesting stocks are gonna suffer Death by Bongo.7
- Precious few pay heed to John Hussman’s warnings that the tech stocks are elevated by “the highest [profit] margins in the history of margins.”
The economic data have been just surreally good. Even optimists are just stunned. This is a Goldilocks economy.~ Paul Krugman, former economist
The world don't need another asshole.~ @icecube
Superstocks
I was glancing through yet another nauseating article about how stupid I was not to own the stocks that soared with the eagles. It reminds me of the now-classic Hindsight Capital spoof ad.8 Those in the markets during the tech boom will recall that, littered throughout the heaps of garbage with “.com” suffixes hanging off their asses, there were some really solid companies guaranteed to deliver high returns, including the likes of EMC, Enron, WCOM, Sun Microsystems, Tyco, and Global Crossing. Of course, a few years later those generals that survived were littering articles offering ten beaten-down tech stocks for under $10 that will make you fabulously rich over the next decade. Although nobody has a clue what the next ten 100-baggers will be, statistically speaking, some blind nuts will find these squirrels en route to being deified as the greatest investors of the era.

Our industry is full of people who are famous for being right once in a row.~ Howard Marks
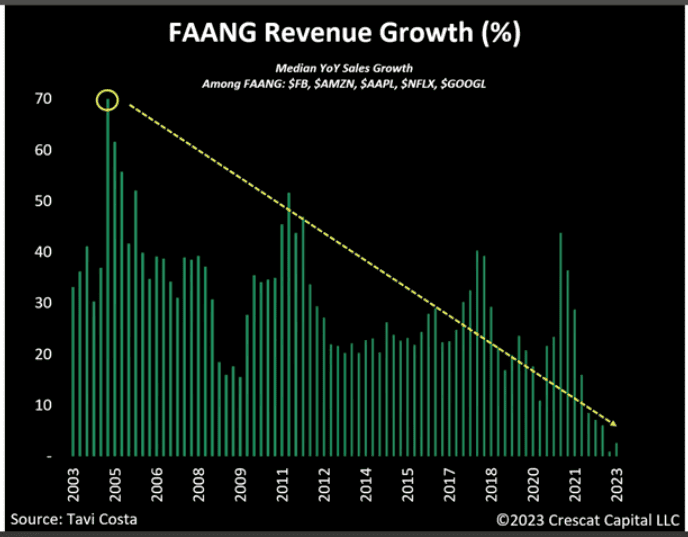
Jesse Felder has been bird-dogging the group called the Magnificent Seven. MSFT, AAPL, NVDA, TSLA, and AMZN are being bought at 65 times aggregate free cash flow, a five-fold expansion since 2012.9 For the mathematically impaired, that is greater than a fivefold expansion that is guaranteed to mean regress because valuation expansions preface valuation contractions. They are at the heart of the most violent market rallies, as short sellers who make the fundamental mistake of shorting “overvaluation” lose their shorts.10 The Mag 7 Index sure looks toppy—double toppy to be more precise—if you’ll forgive my technical jargon.
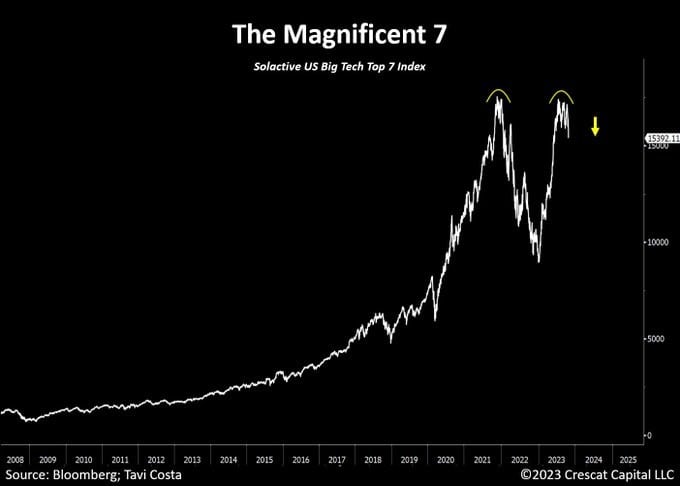
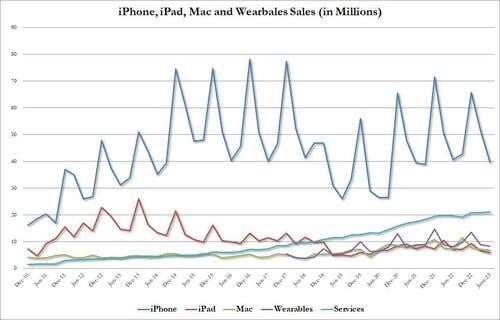
Derivatives strategist Jitesh notes that the top 10 stocks are carrying 86% of the S&P return.11 The QQQ comprising 100 of the hottest tech stocks sporting a $20 trillion market cap has the Mag 7 representing 54% of the total market cap.12 The Mag 7 enjoyed a 72% gain in first half of 2023.13 Apple crossed the $3 trillion mark only four years after crossing the $1 trillion barrier, pumped by cash-burning share buybacks and unburdened by stagnant cell-phone sales,14 stagnant revenues, and the absence of an innovative new product since Jobs died. Apple’s ginormous cash hoard has now been largely zeroed out by over $100 billion in debt taken on to buy back shares.15
The Nasdaq is brought to you by Nvidia: “We make the chips that drive our overvaluation.”
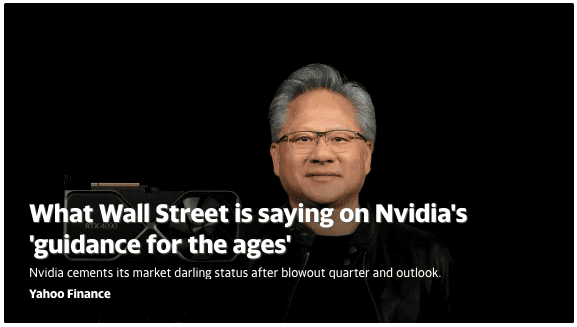
Nvidia (NVDA) is the poster child of the New Era. I have seen cats chase laser pointers with less enthusiasm. I suspect NVDA and its CEO will be pictured on milk cartons when the next big whoosh lays waste to the indices. Some hang the Ponzi moniker on NVDA owing to massive valuations (50x revenues), shady dealings with Coreweave,16,17 and a CEO with bad press from past shenanigans.18 High Tech Strategist’s Fred Hickey says that tech companies are jumping on the AI bandwagon, prompting them to buy “loads of very expensive NVDA graphics chips and boards all while generalized tech hardware sales were collapsing.” Nvidia began talking about selling new shares to “eager investors”, which makes them the first trillion-dollar meme stock. Nvidia’s 50x revenue price tag dwarfs Sun Microsystem’s 10x revenues that preceded its >95% price collapse.
There’s a huge disconnect between (soaring) stocks and end markets.~ Fred Hickey (@htsfhickey), The High-Tech Strategist
If you think Silicon Valley knows what it's doing financially, you really have to rethink things.~ Jim Chanos, Kynikos
Non-Superstocks. Something about the super stocks clicked. Every boom has elite stocks doing the heavy lifting. While pondering the “super stocks” and how much they would burn as they reentered the Earth’s atmosphere, I realized I was missing a bigger point. There are 490 of the biggest companies in the World—Superschlocks—that produce goods and provide services that collectively do not provide investors with positive returns. I emphasize “collectively” because there are winners, but they are offset by the losers. 41% of the equities in the Russell 2000 are unprofitable.19 Goldman puts half of the equities as negative cash flows (losers):20 "Higher funding costs [viz higher interest rates] could force some of these companies to cut labor costs or even close.” In antiquity (the 20th century) IPOs were postponed until the company demonstrated profitability rather than these “dollar and a dream” scams. Now publicly traded companies can go womb-to-tomb without ever earning a profit.
The huge outperformance in the stocks of the largest US firms will become further entrenched as they outspend on capex and buybacks, while smaller companies defensively build up cash levels. Big is beautiful. That’s been the resounding lesson from stock markets over the years. The biggest stocks have not only outperformed the rest, they have made their performance look like a rounding error.21~ Simon White, Bloomberg macrostrategist and superstock enthusiast
Much of this is not new. A recent study of 64,000 global equities in the 1990-2020 window found more than half underperform treasuries.22 “The top-performing 2.4% of firms account for all of the $US 75.7 trillion in net global stock market wealth creation from 1990 to December 2020.” (I contest the validity of the term “wealth creation” and would substitute “wealth aggregation.”) They note that “44.8% of the 17,776 U.S. stocks in the present sample outperformed Treasury bills.” This is not a good performance by the non-Superstocks. The authors went on to implicitly kiss the brass ring of indexing as the best way to ensure that you capture the high-sigma Superstocks. The WSJ chimed in by tracing the last 100 years of gains to the top 4% of equities.23 “Less than half of all stocks even generate positive returns over their publicly traded lifetimes, and only 4% of stocks created all the net gains in the U.S. market between 1926 and 2016.” Robert Gordon asserted that wealth creation began to stall in 1970 and flatlined by about 2005, which is important. The market generates revenues without profits (all hat no cattle). An expensive market generates little real profit, especially after fees and taxes.
The lack of net collective profits for 96% of S&P should bug the shit out of you. If you owned 500 gas stations and 490 of them collectively generated no profit, you’d sell the dregs with both hands. The failure of the owners—the investors—to harvest profits from this vast block of companies is a variant of the Cantillon Effect. As the money flows through the grubby paws of the system, those at the end of the line get only a trickle. Inflation benefits the CEOs, C-suitors, lawyers, and others within the machine—the first recipients of the new money—while investors get pathetic dividends and transitory capital gains. I will return to this issue below.
Net worth has tripled since 2000, but the increase mainly reflects valuation gains in real assets, especially real estate, rather than investment in productive assets that drive our economies.24~ McKinsey & Company
This pattern has repeated itself in the 10 biggest bubbles… Once prices fell by at least 35 percent, they were past the point of no return. The bubble typically bottomed out three years after and 70 percent down from the peak…the long fall in the 10 historic bubbles was interrupted by as many as four echo bubbles — surges of at least 20 percent.25
~ Ruchir Sharma, chair of Rockefeller International
Real Estate. Let’s take a quick peek at real estate. Any Fed Governor worth their paycheck—there are none—will tell you real estate is critical to the Wealth Effect. The Wealth Effect is critical to the 70% consumer economy. A consumer economy is a Potemkin artifice in which we all get rich by consuming rather than producing. Of course, anybody who believes that is a nitwit.
You get in this vicious circle, where higher interest rates cause higher funding costs, cause higher debt issuance, which cause further bond liquidation, which cause higher rates, which put us in an untenable fiscal position.~ Paul Tudor Jones
The housing market, the stock market, and the bond market, all overpriced at the same time. If the Fed knew what it was doing it would not allow bubbles of this magnitude to take place.~ Jeremy Grantham
I have been railing for years on how horrid single-family dwellings are for institutional investors. If you want to make money, build rectangular boxes with 500 rental units. Renting McMansions is unprofitable unless you can get capital essentially for free (check), buy the housing on a fire-sale discount (check), and ramp the hell out of the rents (check). According to the New York Times, there were no megabuck “permanent capital” investors in the single-family-rental market pre-2010, but there are now several dozen26 with “hundreds of thousands of single-family homes.” Contemporaneously, low capital costs ushered in a rebirth of Ted Mack’s Amateur Hour in the AirBNB space wherein amateur speculators pulled off the same trick on a more distributed scale.27 The one thing that could destroy these dreams of vast profits is if rates rose sharply (check). With payments on new mortgages almost tripling and school and property taxes rising, the average homeowner-in-training can only pay half the price for a house than two years ago. I do not care if the housing market hasn’t hit the windshield yet; it will. It must. It’s fourth-grade arithmetic.

And for the pivot mongers thinking a Fed pivot will save them, history shows you will be bludgeoned after the pivot, so there is that. The real disaster is if Powell has grown a spine, is done kiting the markets, is no longer just a jaw boner, and is trying to show that he is Paul Volcker not Arthur Burns. Despite his recent display of spinelessness, I remain skeptical of his intentions and suspect I will be putting a “check” mark on that one too after Powell’s dirty sanchez.
The market is acting like a 15-year-old right now and if you want 15-year-olds to behave, you know what you got to do.28~ Lawrence Lindsey, Former NEC Director
And if that were not bad enough, a quick gander at some TikTok videos showing student-debt-laden youngsters upselling Vente Lattes at Starbucks bitching about becoming the employed homeless. Such ingrates. Those college-educated baristas will not be buying those rapidly depreciating McMansions from the rapidly depreciating boomers. Moreover, they don’t want them. These young socialists-in-training are proud to be lean and green with small carbon footprints. The current metastably low inventory and lack of sales of residential real estate is not a tight market but rather a necrotic market in which potential buyers and sellers are failing to price discover in the marketplace. They will…eventually. Here is how existing home sales are holding up…
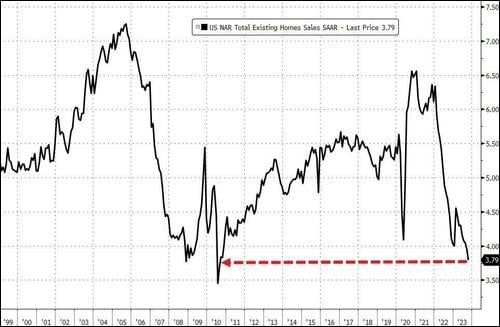
The residential markets with relatively long-duration debt may be the minor league. I was on a panel with the smart and lovable Peter Boockvar, and he made a very important point: even if the Fed goes on hold today, the noose will rapidly tighten around corporate and US sovereign debt markets owing to the relatively short debt duration. Trillions of dollars of what are operationally balloon loans are beginning to blow up. The cities are also changing rapidly as quality of life is plummeting as Zoom calls, Smash ‘n’ Grab Loots, and the homeless proliferate. It is no small feat turning office space into condos, but who will be left to rent them? Many suspect that high-rise jingle mail cometh.
Where We Are in the Big Cycle: On the Brink of a Period of Great Disorder.29~ Ray Dalio
I am not a big Ray Dalio disciple.~ Stan Druckenmiller
Multi-Decade Bull Market: 40 Years of Recency Bias
Enough of this near-term malarkey. As noted, I am not interested in this year’s favorite war, detonating asset class, Fed policy change, yield curve inversion, trendline smackage, or disappearing market breadth beyond their entertainment value. I need to know if I will be OK in 2030 and still liquid in 2040 to fund my retirement with no fossil fuels, eating bugs, and still not flying in air cars. The financial asset markets are in desperate need of a correction. Let me rephrase that: those of us who doggedly resist buying bullshit assets at ridiculous prices are desperate for a correction. This is not a short-term view. A deep, protracted correction is a certainty, in my opinion.The spirit of the times is 'Don't worry about the markets crashing. They will come back up and set new highs.~ Robert Shiller (@RobertJShiller)
What is a Correction?
A correction must…
- substantially drive prices Earthward, and
- inflict a serious beating on investors’ attitudes.
Extended bear markets are more likely to prevent investors from meeting their long-term wealth goals than short crashes.1~ Cliff Asness (@CliffordAsness), AQR Capital Management
40 Years of Recency Bias. The problem starts with the 1987 blip—call it a crash if you wish—that scared investors but was the blink of an eye. In two years, frightened investors were made whole by bold interventions from a free-market libertarian Fed Chair. The 1991 recession-equity dip combo platter was even shorter. The South American currency crisis—the Tequilla Crisis—was solved almost seamlessly by giving multi-national banks $50 billion because they lent too much money to banana republics. The swan dive owing to the Asian flu in 1998 took five months from peak through the Valley of Death to full recovery. The Tech Wreck of 2000 took 7 years to full recovery in nominal dollars but the drop was swift, the markets didn’t plumb historical fair value (see below), the recovery was monotonic (soothing), and the economy escaped unscathed. Investors were dazed but unphased, chanting “I am a long-term buy-and-hold investor! I’m in it for the long run!” with fist-pumping to boot (ironically after getting fisted).
They keep getting these storms and call them perfect storms. I’m thinking these are regular storms and we have a shitty boat.2~ Peter St. Onge (@profstonge), Heritage Foundation
I can hear y’all squealing, “GTFO! Are you telling me 2008–09 wasn’t a correction?” Yes, I am telling you precisely that. The 2008–09 drop neither corrected the imbalances nor broke the speculative fever. Markets hurdled earthward but were stopped out by a $30 trillion central-bank bailout of multi-national banks, with Bernanke playing the role of Neville Chamberlain by appeasing the banks to assure “prosperity and peace in our time.” It’s not likely to work this time either. Equities had a one-night stand with historic fair value—a month or two—before lifting off yet again. We were assured yet again in the aftermath that it pays to just to hang on for dear life, and it did. Investors dusted themselves off and, yet again, began buying the dips. In the four-decade Era of the V-Bounce every dip was bought with relentless liquidity and monetary comb-overs, and every buyer was rewarded. For all of 2020 the entire global economy was prostrate in an induced coma—all consumption, zero wealth creation—yet the S&P closed the year up 13%. That is psychotic. Nothing can stop these markets. Stein’s Law was revised: what has gone up will go up forever…or at least for four decades.
The Cubans, the Kevin O’Learys, the Scaramuccis, the Ackmans - the whole Silicon Valley Crew - these guys all need their clock cleaned in a major way, because they were just bull market, cheap-money players.~ Marc Cohodes
To understand how a forty-year secular bull market is just a phase, not a clear illustration that equities are always the place to be, let us first look at the tailwinds that were unique to the greatest equity run in US history.
I don't expect we see a new high in the market for a long time. We've had very bad policy mix and part of the stress this year has been very stimulative to fiscal policy, restrictive to monetary policy.~ Leon Cooperman
Tailwind 1: Soviet Union. The Russians had not collapsed but they were rotting from the head and sold vast natural resources to the West in desperation to obtain capital, resources that would fuel the boom for the next four decades.
China became the world’s workshop, and the USA became the world’s financial bucket shop.~ Jim Kunstler
Tailwind 2: China. Deng Xiaoping began taking baby steps to take Mao’s 100-year-plan3 to level two by opening China to the West and fostering fledgling free-market principles. I recall the rumors that workers were being allowed to keep some of the products of their labor. When Deng flew to New York to his debutante ball at the United Nations in 1974 their foreign reserves were so flatlined they needed to pass the wok for the plane fare. Deng’s plan to join the 20th century desperately needed capital and all they had to sell was labor, which they did in great quantity and at slave wages for the next four decades. In the early 80s, they began sending hand-selected students to get their PhDs in the West. Cornell Chemistry received six of them. Many did not return, but the Chinese authorities knew that integrating with the West economically would be accelerated by academic and intellectual integration in the West. Sounds benign; it may not be. Over the next forty years, they vendor-financed our purchases of very cheap goods and services.
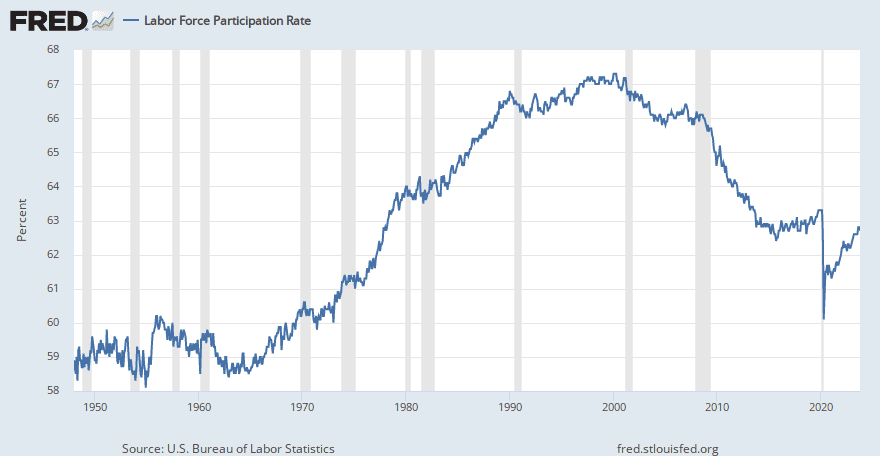
Tailwind 3: Demographics. The boomers had begun entering the workforce in vast numbers, ready to trade in their bongs for calculators and communes for McMansions and meaningful lives. And for the first time ever, they brought their wives with them. As economists worth their paychecks know—a dozen at last count—a demographically young and growing workforce is a huge driver of economic growth.4 A quick gander at the labor force participation rate, however, shows that this was an extension of an uptrend starting two decades earlier and then rolled over quietly with the millenium.
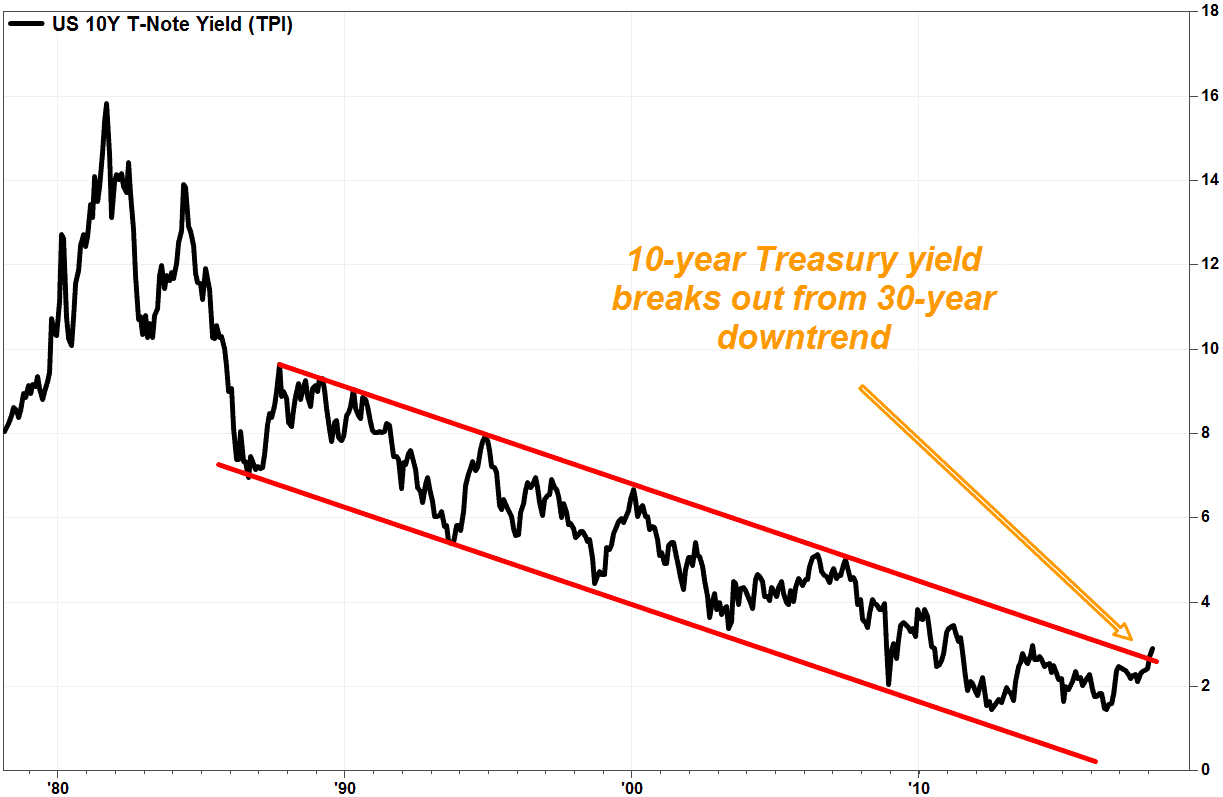
Tailwind 4: Long-term interest rates. If you’ve read Warren Buffett’s iconic 1999 Fortune article as many times as I have,5 you could not possibly miss the punchline: sustainable changes in interest rates are the only variable that matters. When rates are in a long-term uptrend, you get ravaged by your financial assets. When rates are in a long-term downtrend, financial assets party like it’s 1999. Long-term rates began a four-decade march from over 15% to essentially 0%. (The Eurowankers dropped acid and took them negative.) Following an initial drop, it was almost as though somebody programmed the four-decade downtrend into an algorithm. It was a lactating cow. The rates dropped on the heels of forty years of disinflation (juiced by progressively fabricated inflation numbers).
Tailwind 5: Government spending. Any economist really worth their paycheck—a very rarified group—knows that government spending can be a panacea for many years especially if you get to print the currency your debt is denominated in. Eventually, however, this reserve currency privilege hits Triffin’s Dilemma, which, loosely translated, says that being the global reserve currency and the affiliated trade imbalance is an orgy that ends when the stimulus doesn’t raise a pulse. It is a suicide mission in the long term. Well, we have been blowing our wads. (I just realized my mother used to refer to “blowing your wad.” Eewe.) US Sovereign debt scaled to GDP—a natural inflation correction provided they don’t cheese those numbers too much—more than tripled (not including unimaginable unfunded liabilities).6 All forms of private and corporate debt rose like a Phoenix but are starting to look Icarus like.
Tailwind 6: Domestic politics. Over the last four decades domestic politics have been remarkably tame. We went from violent anti-war and civil rights movements to Black Friday at Walmart. The race problems gave way to progress toward equal opportunity with women and blacks in every imaginable position of leadership.
Tailwind 7: Geopolitics. Geopolitics were also quite tame with an asterisk. The peace dividend hailed as the benefits of beating the commies proved illusory as we found more boogie men to battle at great profit for some, but nobody seemed to care. If you were one of the 4.5 million who died since 911 as a direct or indirect consequence of the War Machine life was brief while survivors were left in living hells. However, there is a silver lining: the US’s ability to project military force anywhere in the world supported global trade networks.7
Tailwind 8: Share buybacks. Peter Lynch ranted about the merits of share buybacks as evidence that the corporate insiders knew the company shares were underpriced. Well, that is a quaint idea whose time has long passed. When tax laws on executive income ushered in stock options as compensation, insiders recognized that dividends decreased the value of their options whereas share buybacks increased them. Buybacks also mopped up the excessive shares created by the stock options. Dividends to shareholders dropped to a record low of 1.5% while option holders won. Returning capital to investors was a ruse, in my opinion. I proffered an alternative benign thesis that maintaining fortress balance sheets returning 0% returns in the fixed income markets made no sense. Buying overpriced shares was a desperate reach for yield (if those shares were worth anything.) That mutated to, “Let’s borrow money at no cost to buy shares. What could go wrong?” Shareholders liked the capital gains and were untroubled by the gobs of debt in the low-rate environment. Others suggest that buybacks are a way to repatriate overseas profits,8 an argument that may have substance. That argument has been stretched to claim that “valuation metrics mean little.”9 I am unsympathetic to that triumph of imagination.
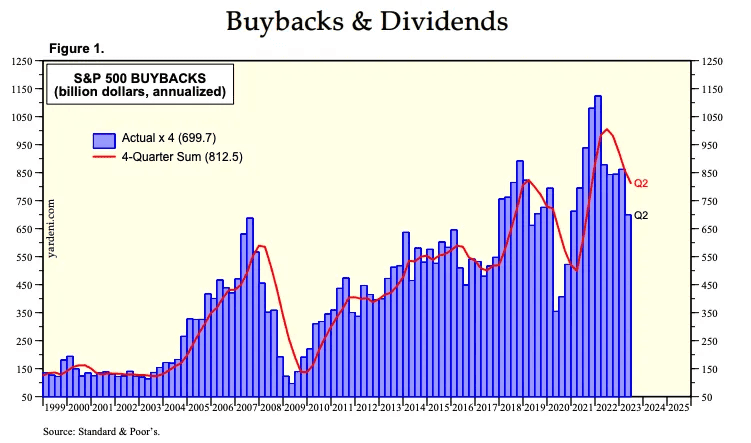
There are ugly anecdotes about huge share buybacks preceding bankruptcy (Bed Bath and Beyond by example),10 burning huge piles of cash (Apple),11 and unprecedentedly low levels of capital expenditures to fund share buybacks. Flat inflation-adjusted wages for 40 years kept expenses low and the Fed at bay. As the market boomed, contributions to defined-benefit pension plans also dropped off precipitously because one need not save when the market does the heavy lifting for you.
Wall Street is not really about investing. It's about asset gathering...Indexes don't just come about because they're good investments, they come about because it's an opportunity for a management company to gather assets.~ Steve Bregman, Horizon Kinetics
What if Adam Smith was here and we explained…indexation and stuff and how capital is allocated? He would say to us, “And what do you call this?” And we’d say, “We call it capitalism.” He’d burst out laughing because it’s the inverse of capitalism to say we give more capital to the companies with the largest market capitalization.
~ Russell Napier
Tailwind 9: Indexing. Michael Green seems to get the most credit for underscoring the importance of the tsunami of dumb money flowing into index funds as a driver of the share price. The problem is that there is no price sensitivity whatsoever. There is no adult supervision, just millions of investors plowing money into the markets. (I once got Bogle to concede this weakness.) Moreover, the market cap-weighted allocations dropping the most money into the largest companies—the Magnificent Seven—while leaving little for the smallest companies poses a problem. It’s like you had a grocery list in which a rising price of cantaloupes and ribeye prompted you to buy more cantaloupes and ribeye. I am not sure exactly what will bring indexing out of favor, but something will. Good ideas cease to work once they are deemed to be good ideas.
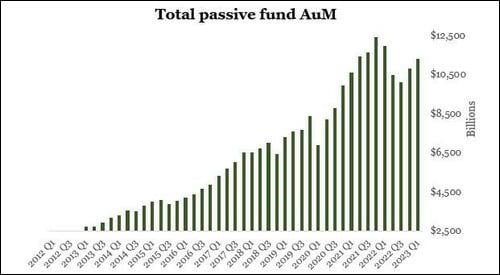
*Forgive the chart crime of starting the plot at a non-zero origin. It’s a rookie error.
It would be dangerous to extrapolate the post-1990 outperformance of US equities, as it mainly reflects rising relative valuations.13~ Cliff Asness
Tailwind 10: Valuation expansion. In 1981 equities were left for dead, sitting at an unbelievable price-to-earnings ratio of 6. For the arithmetically challenged, that means half the market had a p/e ratio below 6. Stocks were scary, but that made them dirt cheap. Maybe if the other factors mauling the markets for the previous 14 years stayed in place they would have stayed cheap, but history shows the seeds of a legendary run had been sown.
Nothing has been cleansed. The monetary excess is still in the system. Valuations are still sky-high. In fact, they got brutally more expensive.~ Sven Henrich (@NorthmanTrader)
Driven by these extraordinary tailwinds, we come to the last and most spectacular statistic of them all: equity valuations—not price but valuations—compounded at over 3% per annum for four decades. Let me say that again for the impaired:
Equity valuations compounded 3% per annum for four decades.
And for the really impaired:

Once you control for this tripling of relative valuations [since 1990], the 4.6% return advantage falls to a statistically insignificant 1.2%... So, what does it mean that almost all the US’s victory came from repricing?14~ Cliff Asness
Case for a Multi-Decade Bear Market
What happens when those tailwinds leading to 3% growth in valuations for four decades becomes a –3% headwind for the next four decades? Oh that wouldn’t happen, right? Don’t be silly. Of course it will happen. Everything is cyclical. Just ask Ray Dalio or anybody else with an eye for history. Low valuations give way to high valuations. It is now time for high valuations to give way to low valuations. It’s the great cycle of life.If you're first out the door, that's not called panicking.~ John Tuld
Let’s take stock of where we find ourselves in the Year of Our Lord 2023. Of course, the next 40 years will look nothing like the last 40 years. The last time back-to-back forty-year periods showed unremarkable change was in the Middle Ages. But we can try to imagine how markets may perform and why.
The existing world order is changing rapidly in challenging ways and that people who are living on the assumption that things will work in the orderly ways that they have gotten used to will be shocked and hurt by these changes to come.1~ Ray Dalio
Headwind 1: Geopolitics. We have royally scorched this one. We completely squandered the peace dividend offered to us when the Soviet Union collapsed. The industrial-military complex simply could not resist the serious profits bombing the piss out of many countries, especially when they create the opportunities. We pissed away the privilege of having the reserve currency by weaponizing the dollar. When we turned the dollar and the banking system against Russia in a fight that was none of our business, we sent the World a clear message: you cannot trust the United States. If your banker said you would get your money back provided you don’t piss them off, you would get a new banker. The great resources of Russia had become so appealing to NATO (read: the US) that we could not resist trying to steal them via a costly war in Ukraine that we have undeniably lost contrary to (a) the media’s boisterous propaganda, followed by (b) their deafening silence. I update my views on Ukraine below. Commodities are fungible: if Russia sells them to our economic competitors, that leaves more for us from the other suppliers. Somehow, however, that seems like a losing strategy for us.
The illegitimate freezing of some of the currency reserves of the Bank of Russia marks the end of the reliability of so-called first-class assets…Now everybody knows that financial reserves can simply be stolen.~ Vladimir Putin
New regimes to defy the weaponized dollar are being created as I type. The BRICs—the loose conglomeration of countries including Brazil, Russia, India, and China—now have almost two dozen countries trying to join that fraternity including OPEC nations. Those who cackle at a BRICs currency becoming a threat are missing the point: we are witnessing abrupt and massive shifts of global alliances to circumvent the US, the dollar, and the Western banking system. Our ties with OPEC were fraying at the edges before the most recent crisis in the Middle East popped up. Fareed Zakaria showed a special moment of clarity when he grasped this:2
If the US dollar's global supremacy erodes, America will face a reckoning like none before.~ Fareed Zakaria
China has its own issues, but they are an economic juggernaut that will patiently wait for their turn behind the wheel. We thought their emergence as an economic powerhouse would make them look like us. It seems that the reverse is happening. I don’t think they will take Taiwan, at least in the military sense. Why would they? We could take Canada too, but we won’t. Taiwan is a huge trading partner, and China is patiently on track to complete Mao’s Hundred-Year Plan.3 I cannot recall any of our leaders’ Hundred-Year Plans.
China is no longer focusing on making basic parts (much the way post-war Japan did) but is moving to high-value-added products. India might pick up some slack as a low-cost producer, but it seems wishful to presume those goods and services will come cheap. Those who look to Africa for the next great untapped region need to bone up on Hernando de Soto’s analyses,4 which focus on why Africa is geographically (geologically) and politically ill-suited for development.
The problem was not people but the law, which was discouraging and preventing people from being more productive.~ Hernando de Soto, The Mystery of Capital: Why Capitalism Triumphs in the West and Fails Everywhere Else
Our exploits in the Middle East that extinguished an estimated $7 trillion and 4.5 million Middle Easterner lives are not good optics. (OK. Let’s call it mass murder or genocide if you insist.) Afghanistan ended with one of the great military embarassments, even if it was, according to my 2021 assertion,5 an intentionally botched third-trimester withdrawal of the troops. Ukraine will look even more absurd as we realize that 500,000 dead Ukrainians died for nothing.6
Something very dramatic has changed in politics in America.~ Matt Taibbi
Headwind 2: Domestic Politics. I don’t believe it is hyperbolic to say we are witnessing a dramatic rise in neo-Marxism that finds its roots in the radical ‘60s. (See Chris Rufo’s America’s Cultural Revolution: How the Radical Left Conquered Everything in Books below.) The future is dark as one ponders the push toward trans-genderism, social justice fundamentalism, climate extremism, social strife tied to the Israel-Palestine conflict that could turn violent, and collapsing trust in institutions and credential experts. Perhaps this is just a phase that will fade into distant memories a few years from now—let us hope—but one cannot rule out Fourth Turning-level upheavals.
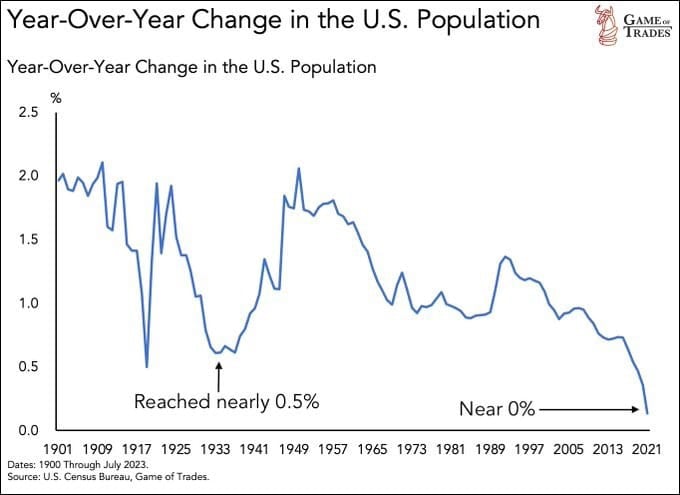
Headwind 3: Demographics. Peter Zeihan is an acquired taste and has serious neocon roots, but his numbers and discussions of global demographics are compelling. Recall that the Club of Rome was squealing about how a failure to achieve zero population growth (ZPG) of 2.2 children per household would cause the Earth to rotate off its axis. Well, we are currently at 1.6 babies per household and on the downslope. If demographics are important, the demographic reversal will have to ride on the back of a generation that is broke, green, less interested in having sex, and confused about their genders. Bear in mind that the 1% annualized growth of the population grew the economy and the numbers consuming that investment pie; investment gains and economic data should be corrected to per-capita. Few do this.
We should be happier to have a job than to have our savings protected.~ Christine Lagarde, October 2019
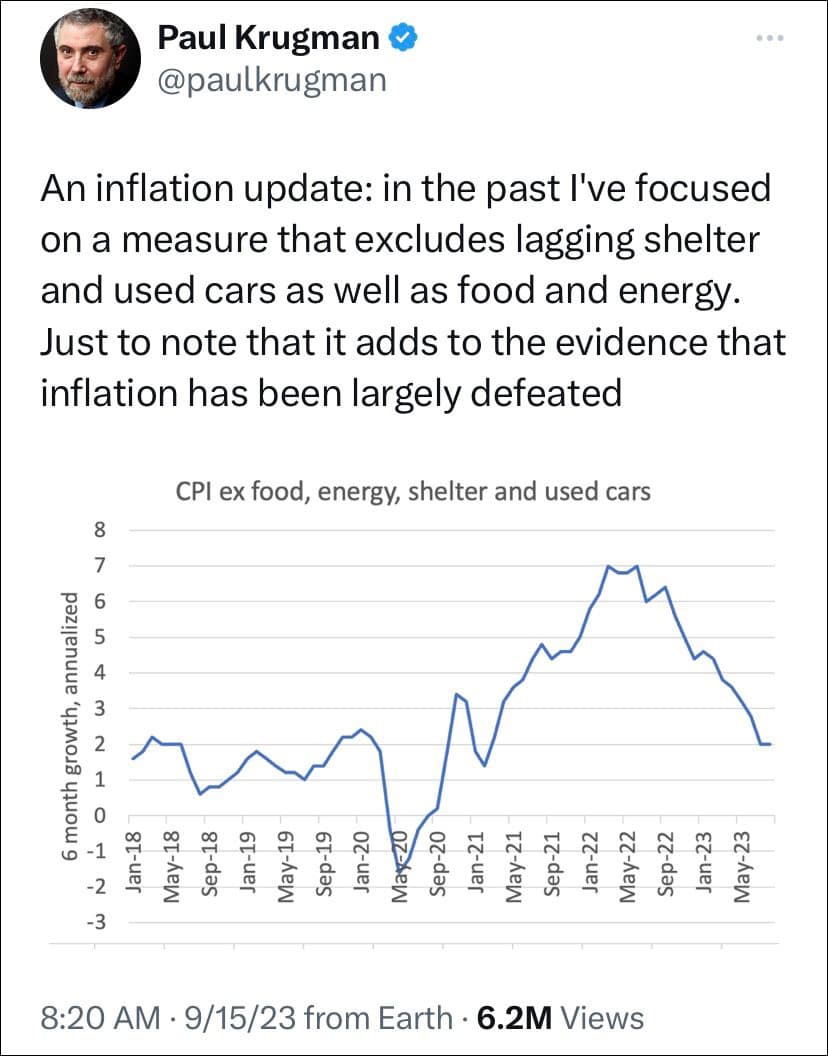
Headwind 4: Interest Rates and Inflation. It is said that the fixed-income guys have all the brains. It is clear Krugman was at the end of the line, but how could he possibly think that excluding everything consumers need leads to a valid inflation metric? Many, like James Grant, tell us that credit cycles are long wavelengths and take years to convince the market participants that the worm has turned. It feels like the four-decade downturn in interest rates may have turned. Inflation may have dug in like a tic. De-dollarization, government spending, runaway debt payments, and the rapidly shifting global alliances could be foreshadowing decades of climbing the Rate Wall of Worry. Wealth disparities have given rise to long-overdue union activity and higher wages, which cuts into corporate profit margins and shows up as inflation at the Fed. Ironically, this will prompt the Fed to step on the economy. Meanwhile, consumers of US debt are dropping like BRICs. Those who flippantly allude to “debt monetization” and “financial repression” as some sort of panacea have never been on the receiving end of those. As interest rates rise, share buybacks will disappear. The urge to remove cash from their balance sheets earning credible returns will dissipate, and the madness of borrowing money to buy back shares will become extinct.
Inflation is the worst thing an economy can have, and I think people underrate that. Every hegemony has been destroyed by inflation.7~ Carl Icahn
The world’s superpower central bank has made such a mess of affairs that it has to pick between two poisons: it capitulates on inflation; or it lets a banking crisis reach systemic proportions. It has chosen a banking crisis.
~ Ambrose Evans-Pritchard
Summers and others see a ‘70s repeat with more inflationary storms to make landfall.
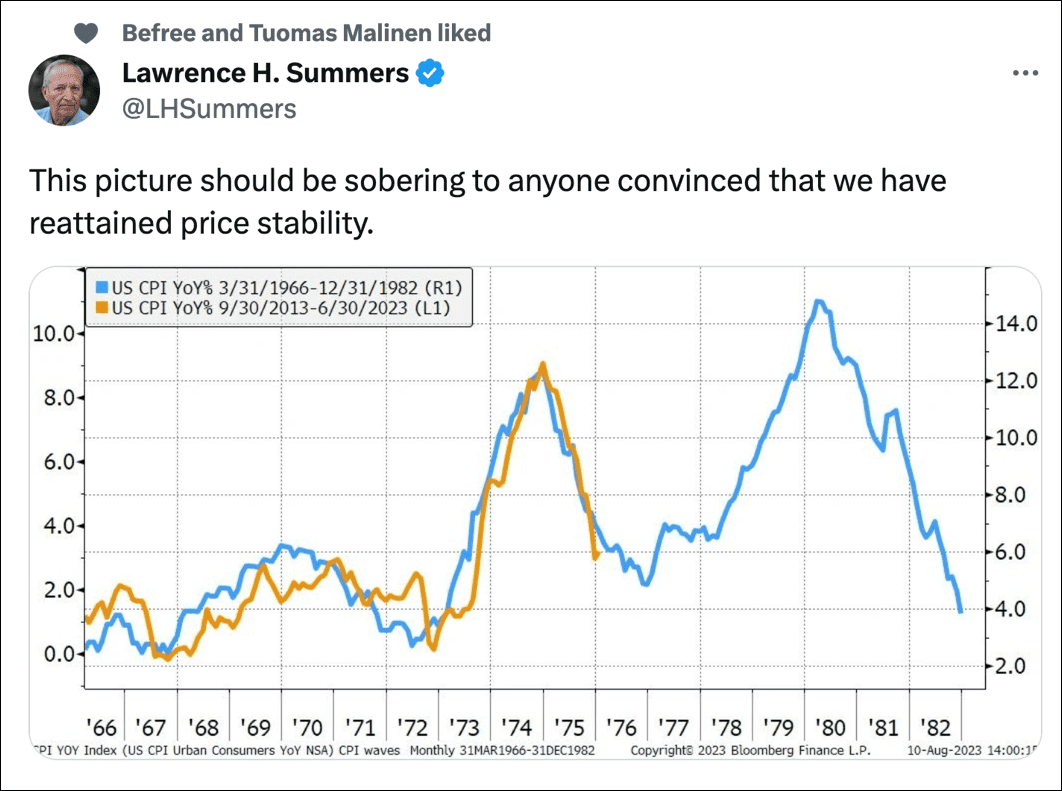
Average folks on the street are not sanguine. I asked Jimmy Iourio what the inflation rate is given the cost of goods at his Italian restaurant. (It is pronounced I-talian.) His answer: 40% over two years.
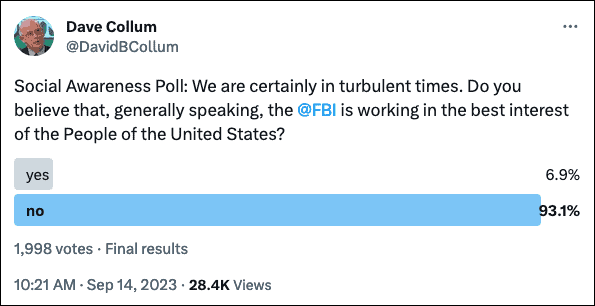
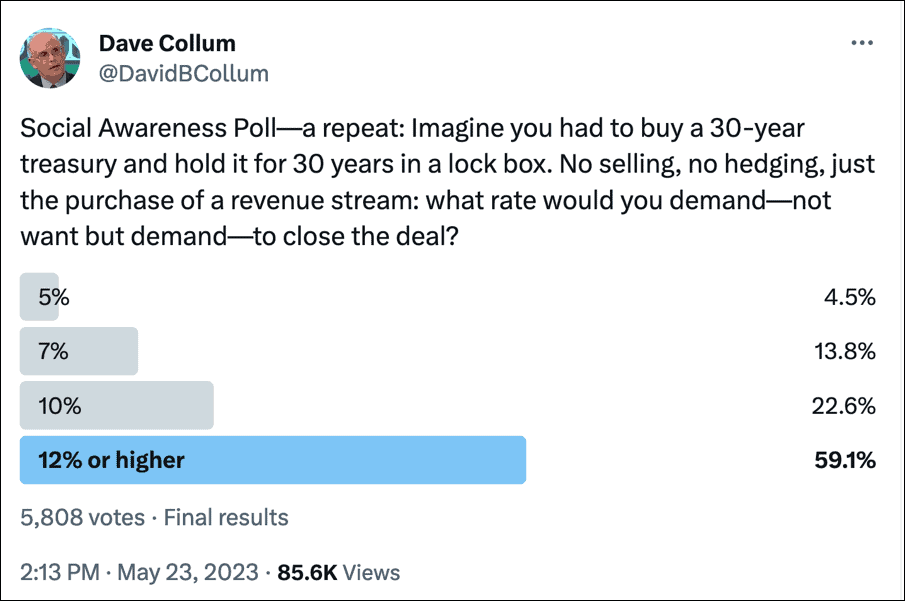
Here is a favorite question of mine in the form of a poll. After the waffling subsides, the answer is always double digits…
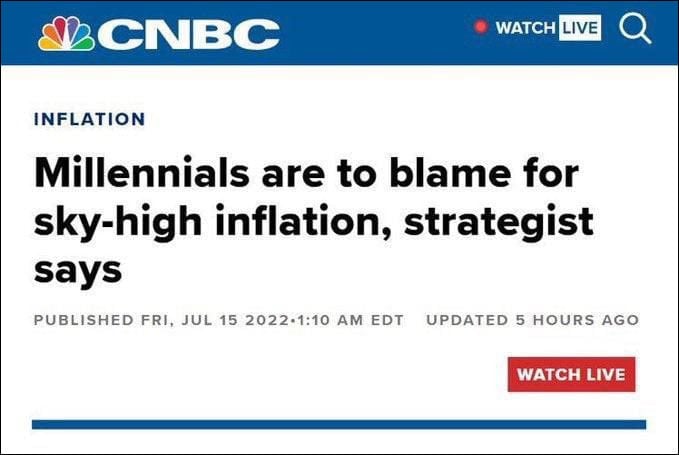
Of course, there may be other sources of inflation besides the debt markets and Federal Reserve. The whiz kids at CNBC found the perfect scapegoat, the generation with no cash to spend…
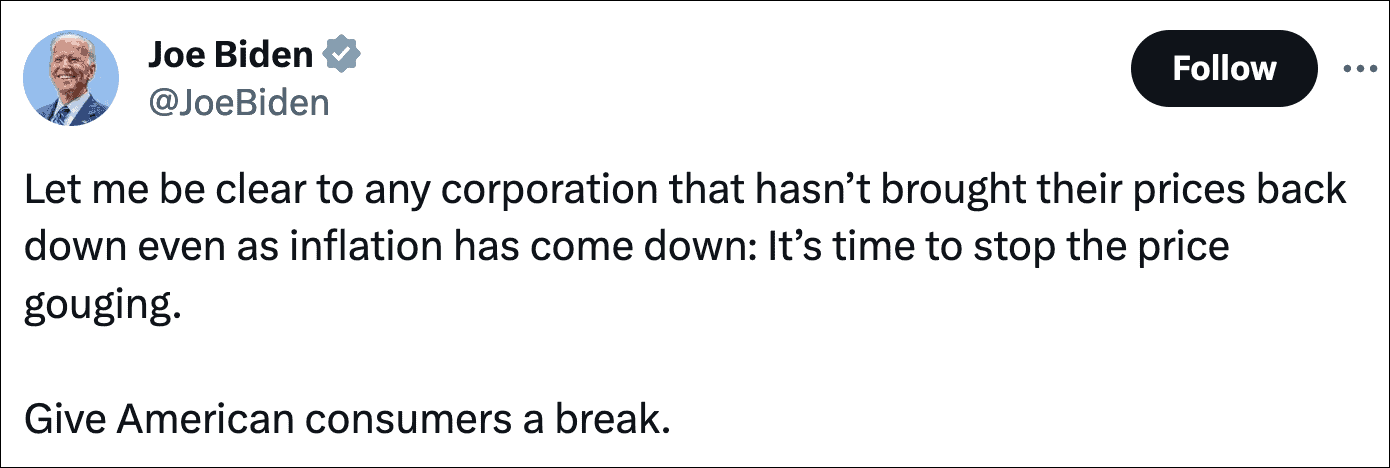
Then there are the scriptwriters for Biden’s Twitter feed who, to add some realism, make him appear to be completely demented…
Headwind 5: Government spending. Does anybody see any mechanism that will stop the perverts inside the Beltway from spending money we don’t have on things we really don’t need? (Part 3 amplifies on that pervert allusion.) The total lack of leadership or even basic lack of morality inside the Beltway feels like end-of-empire shit to me. Maybe the long (often multi-decade) credit cycle hasn’t turned, but cranking out 10% per annum of sovereign debt is not going to be extinguished by 10% growth in GDP. Maybe Triffin was full of shit, but we are testing his hypothesis by spending like an end-of-empire hegemon. Our leadership is more Nero-Caligula than Julius-Augustus. The next and final stage of the US Empire—whether you read Neil Howe’s Fourth Turning or Ray Dalio’s Principles for Dealing with the Changing World Order: Why Nations Succeed or Fail (see Books)—is the cathartic phase, which is code for violent and deadly.

Headwind 6: Valuation Contraction. Nobody talks about market valuations except those trying to give you a toaster oven to open an account at their brokerage. Valuations are, however, a curiously useful metric. I track about two dozen last laid out in lurid detail in 2021.8 I won’t repeat that analysis in its entirety because nothing has changed. Here is the Reader’s Digest version in which I insert a couple of cute ideas while pretending not to recycle the rest.
Financialization is profit growth without labor productivity growth.~ Ben Hunt
All valuation metrics share a common trait: they represent the price of assets (often equities) divided by something they should track. They are inherently inflation correcting, which means they should simply flop around a historic mean but, over enough time, remain unchanged. High valuations give way to low valuations which give way to high valuations, and this has gone on for millennia.
Stupidity got us into this. Why can't stupidity get us out?~ Will Rogers
All metrics pretty much lead to the same conclusion, which I illustrate with the Case Shiller PE. In the first graphic, we see the Case-Shiller p/e from 1880 to 1994:
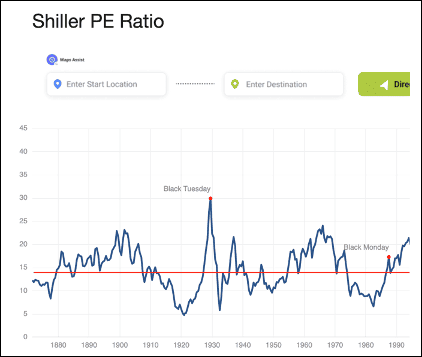
That flopping around the mean part is self-evident. Now that I have anchored your thinking with the bias of a historic fair value and illustrated regression to and through the mean, let’s tack on the last 3 decades in the following chart…
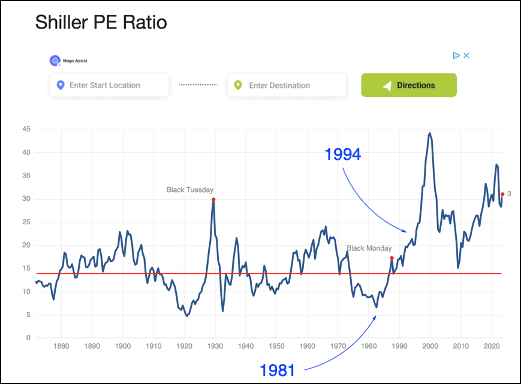
Now do you see the problem? I also overtly placed the break at 1994 because of an observation made in my previous analysis that 1994 is the year all market valuations, while high, left orbit.9 If you find some new-fangled valuation metric that doesn’t go back to 1880, just find the valuation in 1994, assume it represents 50% above historic value, and compare it with today. As to why 1994 is some special moment is unclear. Maybe that year’s bond bailout never subsided. Mike Green says that 1994 coincides with the arrival of a tsunami of dumb money coming into the markets in the form of price-insensitive market indexing. The latter two decades of this wonderous four decades witnessed debt-fueled share buybacks. To complete the round trip back to the trough of 1981 represents an 88% correction. What is an 88% correction? It’s a 75% correction that then cuts in half. So much for everybody’s nest egg.
The S&P 500 has soared nearly fivefold in one decade to multiples of earnings, sales, book value—take your pick—we have only seen twice in recent history....the equity market no longer seems to trade off the economic fundamentals...the market has rallied completely on the back of multiple expansion... The ratio of corporate debt-to-GDP is at all-time highs....An enormous volume of corporate debt has been issued exclusively for the purpose of buying and retiring shares. This includes both buybacks and acquisitions of other companies. And in classic mature-cycle fashion.~ David Rosenberg
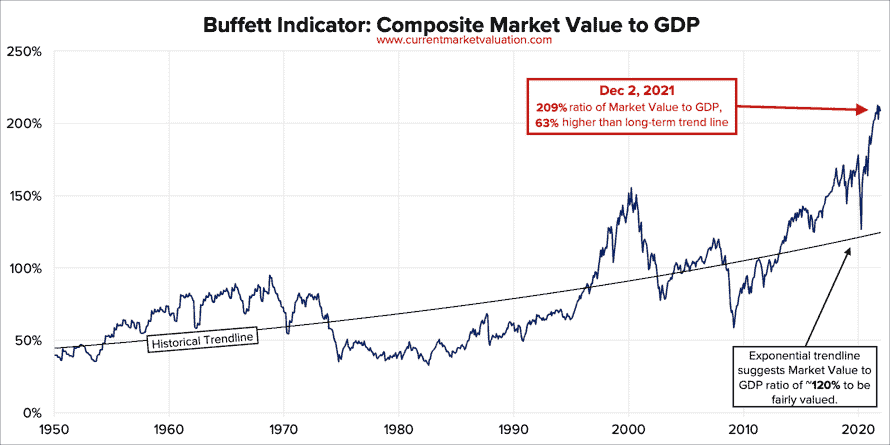
Let’s look at two more valuation metrics for fun. The logic that the market value of the nation’s 500 largest companies should reflect the nation’s GDP seems almost immutable. See that trend line? Would you have drawn that line if I had clipped the plot at 1994? Those who draw it have a tough row to hoe (road to ‘ho) justifying why the uptrend is sustainable.
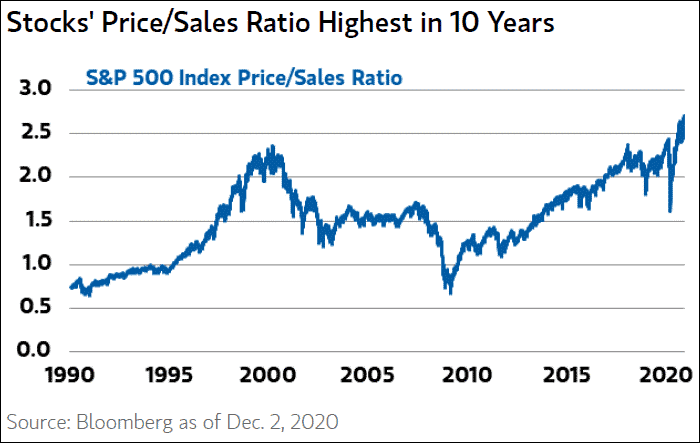
Here is price to sales (which I infer is synonymous with price to revenue). Since it doesn’t go back to 1981 to assess the peak-to-trough potential pain just look at 1994 and assume that it is 50% over historical fair value. The claim that it is the “highest in 10 years” is also a little odd.
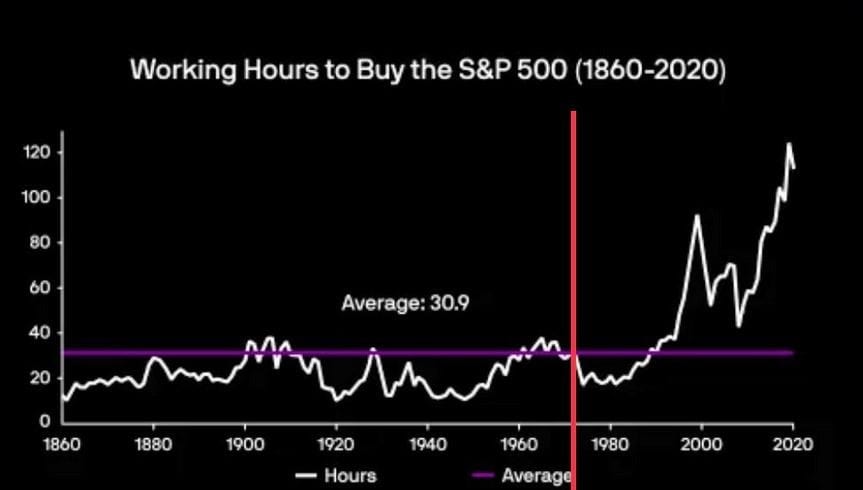
Here is an entertaining one: the hours required to work to buy the S&P. This may be the question of a simpleton, but why has the S&P become so expensive to buy in terms of man-hours of labor if the digital world is so efficient? Note that the historic average looks like a market top in any other era except the last 30 years. Even so, a return to that optimistic target valuation would be a 75% correction.
This Hussman valuation corrected for mean-regressing bloated profit margins (justified by others as the wonders of the efficiency noted above) is at the apex of the Pyramid of Doom.
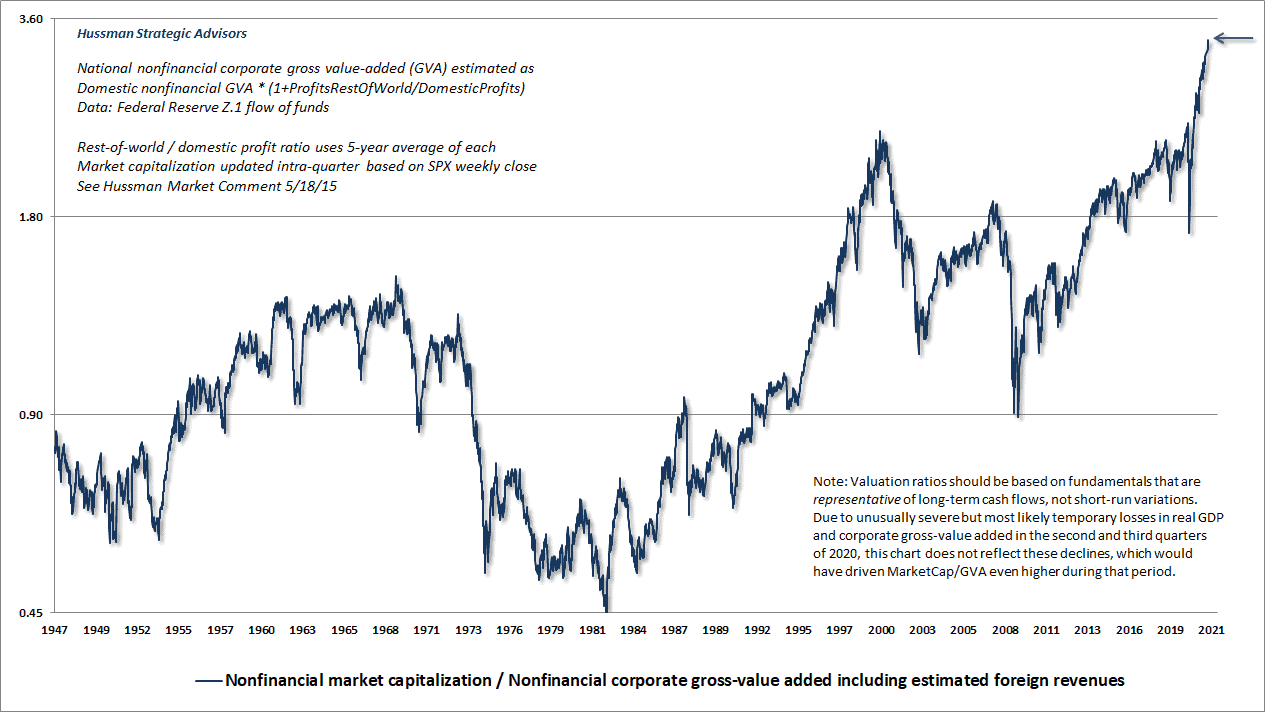
Here we sit with valuations in the nosebleed range of 120-150% above the historic mean. Investors are implicitly assuming that (a) valuations will not mean revert because regression to the mean is no longer a force of nature, or (b) they will be smart enough to get out at the top. Such assumptions are hallmarks of an unstable personality. On the off-chance I might be right, you might want to read up on gibbeting…10

I intentionally use the phrase “run-of-the-mill” to describe potential market losses of –30%, –55%, and –60%, because none of these estimates can be considered ‘worst case scenarios.’11~ John Hussman

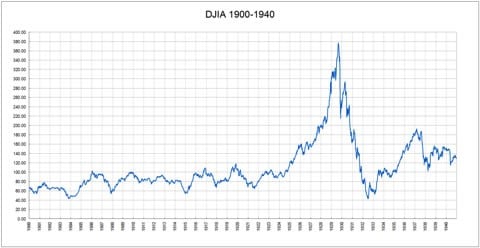
Lowered Expectations. Avid readers with good memories may notice I am about to go green by recycling a couple of graphics. I showed the first graphic depicting markets in the first forty years of the 20th century to a mucky muck at The Economist, and he had not appreciated how that nasty little two-decade boom-bust cycle only interrupted a trend in which investors clawed their way up the Wall of Worry at a 1.3% annualized capital gains over four decades. There were dividends—way more than today—but there were also taxes and fees. That was four decades that Northwestern’s Robert Gordon considers one of the most productive for inventions of labor saving devices.12 If you had invested throughout the Industrial Revolution your equities and bonds would have contributed to your aggregated personal wealth comparably despite Jeremy Siegel’s claims to the contrary.13,14
I created the following idealized graphic (using ChemDraw!) to illustrate that if the GDP grows 2% annualized (blue curve) and over four decades equities rise approximately 150% above fair value (red curve). I serve up four scenarios to return to fair value: (a) drop straight down by 60%, which will create Bald Britney-levels of volatility but won’t correct anything as dip buyers armed with 40 years of recency bias will come in like a flash mob to create a V-bounce yet again, (b) drop 20% over 25 years, (c) tread water for 35 years, or (d) scratch out a 30% gain over 50 years (0.5% annualized). Pick your poison for the meanest of reversions and hope that we don’t correct below historical fair value because then the story darkens markedly.
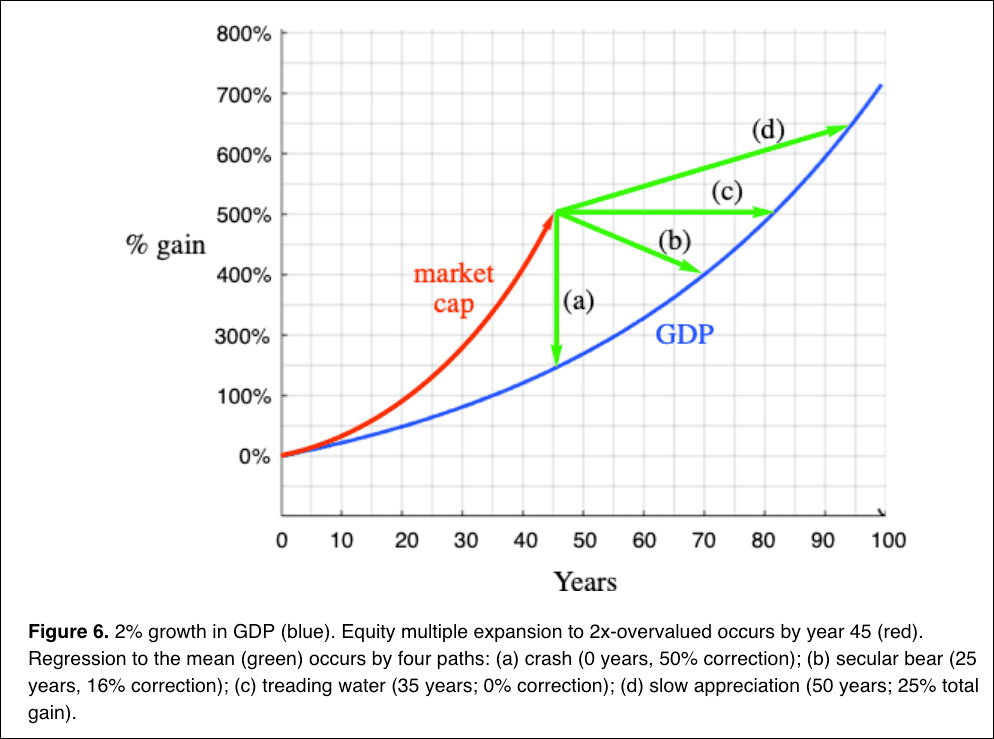
U.S. GDP grows about 2% per year on average~ Howard Marks
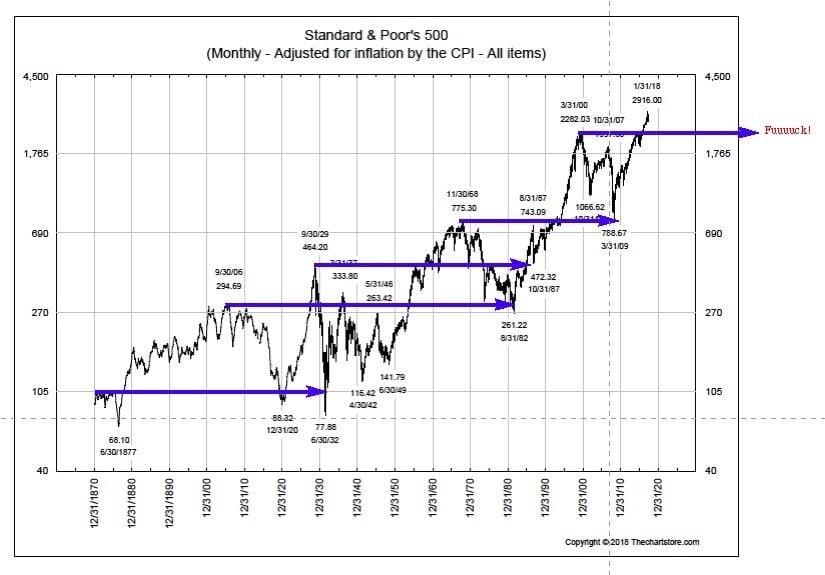
Are these curves even remotely realistic? In a word, yes. Here are more ChemDraw arrows superimposed on a graphic by Ron Greiss of the Chart Store showing the inflation-adjusted (reconstructed) S&P 500 beginning in 1870. I am relatively uninterested in how long it takes investors at a market peak to fight their way through the Valley of Death to finally break even, which is usually a decade or two. (Nikkei investors should be so lucky.) The key question is when did that previous market top get tested for the last time? How long must investors tread water to get from the peak to the safety of the final trough? Those are the blue arrows, and they are 40–75 years long. Is Investor Americanus emotionally and financially ready to withstand a 40–75 year ice age?
And just to bring one last bit of joy to the story, I bring to you another Ron Greiss creation. Instead of using bullshit CPI numbers, Ron corrects for inflation using the M2 money supply.
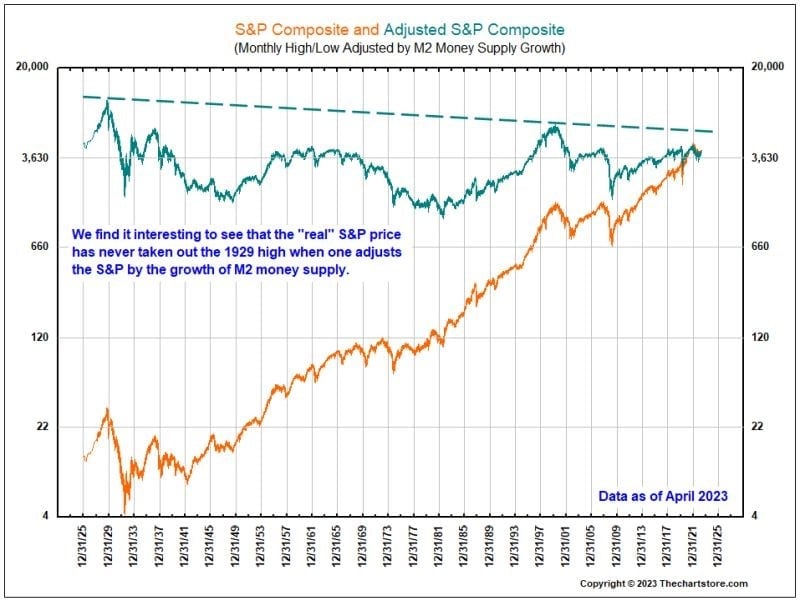
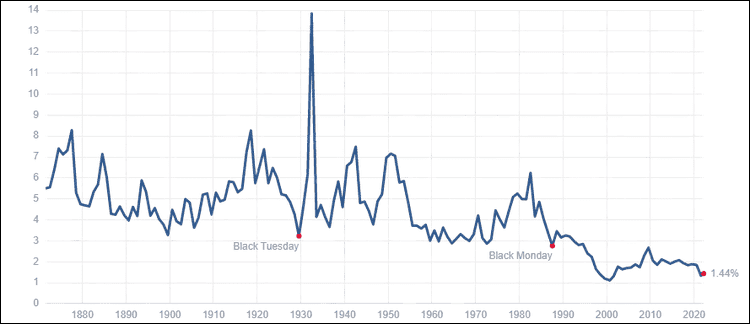
Seems like a pretty clean correction if you are a Friedmanite. The markets were dirt cheap in 1945 and again in 1981. But nagging questions should take your breath away: is it possible that 150 years of capital gains in the equity markets are 100% inflation and that the real investment returns are 100% traceable to dividends? Does it trouble you that dividends dropped from 6.5% to a century low of 1.5%?15 How will 1.5% hold up against fees and taxes?
US equity investor circa 2064 AD unearthed by market archeologists centuries from now…

The U.S. economy is obviously performing exceptionally well with continued solid job creation, inflation gradually moving down, robust consumer spending. I'm not anticipating a downturn in the economy.~ Janet Yellen, June 2023
You can never trust predictions about the future from people who deny the present.
~ Alex Epstein
It may be time for Yellen to return to the Shire. The pain is not over when you squat over the secular bear trap, and it clamps you in the groin. Just wait until you hit the end of the chain. It will feel like a Tarantino finale: sketchy historical precedent but lots of blood and guts.
This is a companion discussion topic for the original entry at https://peakprosperity.com/dave-collums-year-in-review-finance/