Little did I realize when creating the short video below how prescient it would quickly become in the wake of the recent Brexit vote...
Its message is simple: there's a preponderance of data that shows the world's major asset markets are dangerously overvalued. And when these asset bubbles start to burst, the 'save haven' markets that investment capital will try to flee to are ridiculously small. Investors who do not start moving their capital in advance of crisis will be forced to pay much higher prices for safety -- or may find they can't get into these haven assets at any price:
The morning after the Brexit vote is provided us with ample validation of the video's thesis.
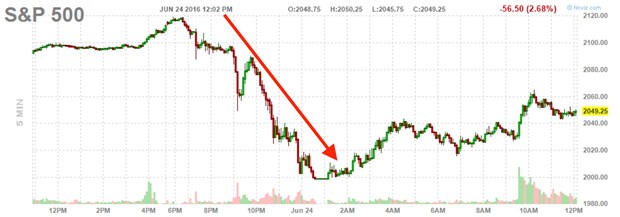
Stock prices immediately plunged:
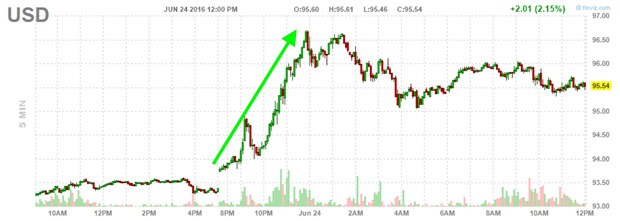
The US dollar surged:
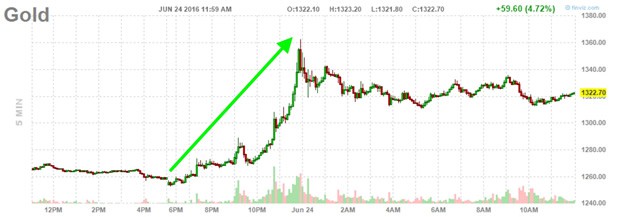
Gold put in a $100/oz reversal (which has since moderated a bit):
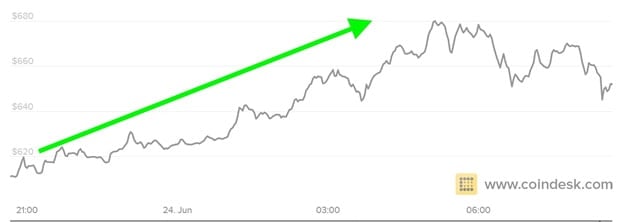
And Bitcoin jumped:
And look at the capital fleeing derivatives like sovereign credit default swaps. Losses of over 30% in a matter of hours. Yikes!
Response To Reader Requests
Over the years of writing about the risks in markets so distorted as the ones live with today, many Peak Prosperity readers have often asked me how my personal portfolio is positioned. Am I loaded up on save haven assets, and if so, which ones? Do I have long positions in stocks and bonds? What sort of private investments do I own? What am I focused on most going forward?
In Part 2: How My Personal Portfolio Is Positioned Right Now, I've finally decided to openly answer that question. I realize that many people are wrestling with the difficult challenge of identifying and assessing opportunities for safety as well as for prudent return in a market where price signals are bastardized and market risks obfuscated. Hopefully by sharing my own positioning, these folks may find a few constructive ideas worth discussing with their own financial advisers.
I'd be happy to explain. I apologize in advance for not having the time to provide a short answer.
A CDS is a Credit Default Swap, and here's a reasonably clear explanation:
A credit default swap is, in effect, insurance against non-payment.
Through a CDS, the buyer can mitigate the risk of their investment by shifting all or a portion of that risk onto an insurance company or other CDS seller in exchange for a periodic fee. In this way, the buyer of a credit default swap receives credit protection, whereas the seller of the swap guarantees the credit worthiness of the debt security.
For example, the buyer of a credit default swap will be entitled to the par value of the contract by the seller of the swap, should the issuer default on payments. If the debt issuer does not default and if all goes well the CDS buyer will end up losing some money, but the buyer stands to lose a much greater proportion of their investment if the issuer defaults and if they have not bought a CDS.
As such, the more the holder of a security thinks its issuer is likely to default, the more desirable a CDS is and the more the premium is worth it.
So it's really just a bet between two parties which sets a price for the probability of a default in a given bond. The more likely the chance of a default, the higher the cost of the insurance.
Let's imagine that I am holding $10 million of Australian ten year government debt and I want to insure that pile of bonds against the possibility of default. Sure it's remote, but I want or need that risk to be eliminated.
Let's further imagine that the cost of buying that insurance is 0.002882% per year. That's a clumsy number so let's express that in basis points (bp) where each bp is 1/100th of a percent. Then the cost is 28.82 bp.
This means that for a year of protection I am going to pay (0.002882 X 10 million) = $28,820.
If AUS defaults I get $10M. If AUS does not default the issuer of the CDS gets to keep my $28,820 and I get to decide if I want to pay another $28,820 for another year of protection. But this level of cost is bearable because the current yield on AUS ten year debt is almost exactly 2% so that ten million I am holding is yielding $200,000 per year in interest.
So here's how to understand the examples above. Let's start here:
There are three numbers in that box. Two are measured in basis points (again, each bp is 1/100 of a percent) and the other is a percent value. Taken together, the formula to understand them is this:
10.61/(39.43 - 10.61) = 0.368 [or 36.8%]
The interpretation of this is that the day before this box of numbers appeared the cost of insuring AUS ten year debt was 28.82 bp (= 39.43 - 10.61). But today that value is 39.43 bp meaning that the cost to insure AUS ten year debt went up by 36.8% in a single day.
Now our hypothetical $10 million insurance cost from the example above is $36,800 per year.
These numbers are still pretty low…mainly because the possibility of a default in Australia is very low. So let's wander over to an extreme case because it illustrates how we can use CDS rates to tell us something about how the market prices in the probability of a default.
Greek five year debt is trading at a level that provides a tasty, fat 9.64% yield. Sounds good right?
Wandering over to the list of CDS costs for various countries we see this:
Oops. Here we discover that it will cost us 1085 bp, or 10.85% per year to insure our Greek 5 year paper which is yielding 9.64%.
If we are insuring $10M of Greek 5yr debt, we'd be receiving $964,000 in interest but paying $1,085,000 in CDS protection money.
Essentially we are making a $121,000 bet for a $10M payoff that Greek five year debt is going to default this year.
What this tells us is that the chance of a Greek default is very very high.
Bottom line: If I have bought CDS paper that shoots up in value, I can sell it for a profit. Yay! But if I am the issuer (or seller) of CDS paper I am now carrying a ton more risk on my books without any additional compensation (I only get what I sold it for, period).
So the proper interpretation of the CDS explosions you asked about is that the buyers are all happy and the sellers are all sad.
[Note: one does not have to have any underlying debt at all to make a CDS wager. I can insure $1M or $100M or eleventy trillion of debt by purchasing a CDS contract without holding a single dollar's worth of the debt I am "insuring"]
Great explanation, thank you. My assumption would be that profits are kept but the losses are distributed and shouldered by the public, directly or indirectly? When a CDS is triggered the trickle down effect may be felt far and wide?
AKGrannywgrit
Are CDS's reinsurance backed by Munich re? I ask because Munich re must be exposed to increased risk due to Climate Change.
The insurance companies may not be in a position to honour their obligations if Munich re goes down.
London is headquarters to one of the world's biggest capital markets. Traders will exploit news like this to further distort the markets and cause market volatility along with their partners-in-crime on the other side of the pond in New York. Headline news once again causes some fearful and some greedy investors to speculate on where to put their chips. Some will win, Some will lose. But in the long-run a Brexit will not change much economically - there aren't going to be mass firings, banking collapses nor trade-tariffs going up any time soon, if ever. It's best to just ignore the noise and ride this one out and take advantage of opportunities to buy low.
Reuters just reported the massive losses incured by Brexit.Looks like massive wrong way bets have been thrown into the mix.worse than 1987 and Lehman collapse.This is horrific!
Chris, thanks for the lucid explanation! One remaining question: why is there a thin green arrow pointing down to the left today's CDS cost? The cost went up and holders of existing (before today) CDS just saw an increase in the value of the CDS they hold (paying less than today's cost). Thx!
I'm not 100% sure, but I'm going to say that's indicating the direction of the most recent tick.
Like a stock candle that shows green when the price is going up and red when the price is going down, the CDS arrows are indicating the movement of the bp cost of these issues.
I think, traders will exploit news like this to further distort the markets and cause market volatility along with their partners-in-crime on the other side of the pond in New York. Headline news once again causes some fearful and some greedy investors top speculate on where to put their chips. So, some will win, some will lose. But in the long-run a Brexit will not change much economically - there aren't going to be a mass firings, banking collapses nor trade-tariffs going up any time soon, if ever. It's best to just ignore the noise and ride this one out and take advantage of opportunities to buy low.
Peter
you heard it correct that many people are wrestling with the difficult challenge of identifying and assessing opportunities for safety as well as for prudent return in a market where price signals are bastardized and market risks obfuscated.
So, in this overflowing unpredictable market if you are looking for web design related service sthen do checkout our sites for more details : RailsCarma & Carmatec