Emotions are running high for the investment community in the wake of recent market volatility. Up until August, we had been in the third longest period in market history without a 10% correction. Since then, stock indices sold off hard, only to bounce once again over the past two weeks of trading.
As you’d guess, the generic punditry has been out in full force. A good number of very well respected technicians are not mincing words: We've entered a bear market. No equivocation.
On the other side of the equation are plenty proclaiming a successful retest of the lows has been made, and now away we go. Earnings will be better next year. No recession in sight. Just another dip to be bought, right?
And certainly the truth is….No one knows. Especially in today’s world where global central banks can concoct further QE/monetary schemes at the drop of a hat. Let’s face it, at this point the global central banks are all in. In fact, beyond all in. Without question, the US Fed knows that if equities fall, they lose the high end consumer. (Wal-Mart shoppers have already long been lost)
I thought in this discussion I’d run through a number of indicators I've been watching that will hopefully help answer the key question – was the recent market turbulence a sign of a short-term correction, or something larger? We know there's no single Holy Grail metric in this wonderful world, but I tend to think of indicators as mosaic pieces. If we can get enough pieces in the right place, we have a good shot at actually deciphering the “picture” of what is to come. And for that, we can only really rely on historical experience.
At The Margin
A number of months back, in fact just prior to the recent correction, I wrote a piece about US margin debt. It had just climbed above $500 billion for the first time in history. The conclusion of that article was that today’s margin debt acceleration would be tomorrow’s price volatility. Nothing in that article about timing at all. But as we stand here today, I believe watching margin debt levels dead ahead will be very helpful.
The history of margin debt in graphical form is what you see below.
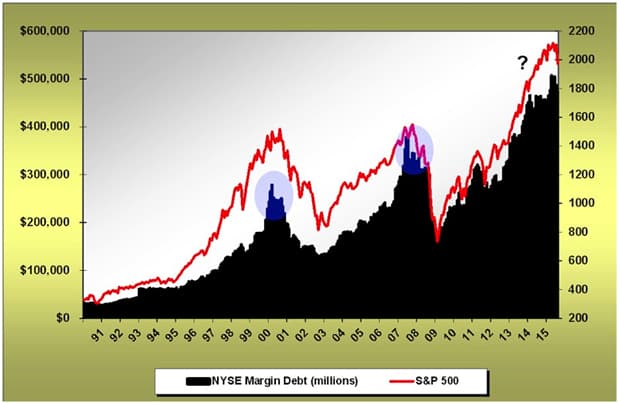
Not surprisingly, historical equity market peaks of significance have been accompanied by cycle peaks in margin debt levels. The chart above is clear. What has been most helpful in the past is to watch for divergences between margin debt levels and price. At the prior two equity market peaks in 2000 and 2007, price actually went to a new high temporarily, while margin debt levels diverged and continued falling. In hindsight, this was a key tell-tale top of cycle divergence.
As we stand here today, margin debt levels have begun to decline from their summer-time peak. Admittedly, the data is only current through August at this point and a contraction in margin debt for August should be no surprise at all. But here is what I believe will be helpful ahead: if this is simply a correction in an ongoing bull market, then we should expect margin debt levels to again accelerate and move to new highs. Why? Because that is the exact fingerprint history of margin debt and equity market cycles. I do not expect margin debt to contract meaningfully (20%) unless this is truly a new bear trend. And we will not see a true move downwards in margin debt until after we see a few claw marks. So watching for new highs that would corroborate further upside becomes one important watch-point of the moment in my book.
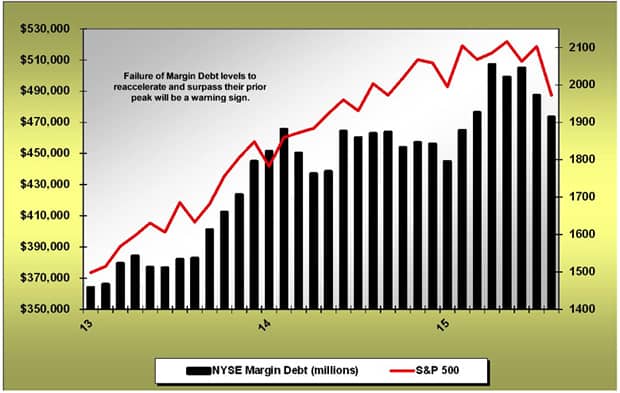
The chart below is a close up look at the last three years. For now, margin debt levels in the US peaked in April. Keep your eyes on these levels in the months ahead. If margin debt cannot make it back to its highs, we need to consider this a cycle top in the equity market:
Oh Behave!!
One thing I've been watching for is a change in market behavior in response to central bank commentary. And we've been finally seeing a bit of that from time to time in recent months.
As you are fully aware, the Fed again declined to raise interest rates at their meeting last month, making it now 60 Fed meetings in a row since 2009 that the Fed has passed on raising rates. Over the 2009 to present cycle, the financial markets have responded very positively in post-Fed meeting environments where the Fed has either voted to print money or voted to keep short term interest rates near 0%. Not this time. Markets swooned in the immediate aftermath of the decision on the again seemingly-positive news of no rate hikes. Why?
Although we are clearly not fully there yet, we need to think about the possibility that investors are now seeing the Fed (and really all global central bankers) as trapped. Trapped in the web of intended and unintended consequences of their actions. As I have argued over the past year, the Fed’s greatest single risk is being caught at the zero bound (zero percent interest rates) when the next US/global recession hits. With declining global growth evident as of late, this is a heightened concern and that specific risk is growing. Is this what the markets are becoming more sensitive to?
Behavior does not change overnight. And certainly the rally back from the end of September lows has been impressive. But it has also been accompanied by chatter about a potential QE4 or NIRP stateside (neither of which I believe is in the cards any time soon). Moreover, with the release of the FOMC meeting minutes a few weeks back, the Fed admits in their own words they are scared of “volatility.” (Translation? A down equity market.) So in one sense investors know full well they have the Fed cornered. Throw a tantrum and they will change intentions/actions on a dime. And now the Fed even admits it!
But when will continued zero rates or “threats” (Draghi) of expanded QE simply no longer be good enough? I think this is one of the key “tipping points” to watch for. I think we are edging our way toward that right now. But slowly, and not in linear fashion.
It's clear in recent weeks that for many companies, quarterly revenues and earnings growth is a struggle. In fact, for a good number, deterioration has been ongoing for years now. Caterpillar not only missed again (huge surprise, right?), but has now reported 34 consecutive months of declining world sales. In it's latest report, the company announced 10,000 to be laid off over the next few years. And Caterpillar is not alone.
IBM reported its lowest revenues in 13 years at $19.3B. For perspective, literally three years ago in 3Q 2012 that number was in excess of $29B. The year-over-year decline in revenues (not earnings, revenues) was 13.9%. In comparison, IBM never even dipped this low on rate-of-change revenue contraction during the “Great Recession”. Good thing they’ve levered up their balance sheet to buyback shares! (After all, it's the shareholders who “own” the balance sheet and the executives who have the options.) The number of revenue and earnings missing in the current quarter so far, has been more than noticeable.
Walmart indeed made the gallant gesture of raising wages for their employees. And the move cost them dearly, as they just announced a 12% reduction in earnings guidance for next year. Remember, this is one of the largest retailers on planet Earth, accounting for 10% of total retail sales in the US. Suppliers will be squeezed and squeezed hard. More fallout will come in quarters ahead, and be certain, Walmart will react with massive cost controls.
On the bright side of the earnings equation, we’ve also seen a new wrinkle in a number of cases. Biogen announced very respectable numbers and growth. But simultaneous with the “good news” is another type of news – they are laying off 11% of the work force globally. Microsoft “crushed” the numbers….and also crushed another 1,000 employees into the unemployment line. The issue being: even companies reporting strong numbers are letting folks go during supposedly "good" times. Why would management teams be doing this?
I could go on and on about many more examples, but the issue is the revenue and earnings stagnancy to deterioration is increasingly noticeable and the management commentary has backed this up.
What seems apparent is that, for a good number of companies, weakness has accelerated during the prior quarter. Could it be the stumbling of the “symbol” of the economy, the stock market, that has prompted such an immediate response? I wish I knew the answer, but for a while now I have been of the opinion that central bankers are scared to death that if equities start failing, so will the domestic/global economy. They know full well that it is the high end of the wealth demographic that is doing the yeoman’s work in holding up the economy broadly. If they lose the equity market? They lose the high end consumer. And, let’s face it, there's no middle class left below to pick up the ball. Stagnant wage growth, 0% return on savings, and rising costs of living have squeezed it dry..
So in one sense, it all comes back to equities. The central bankers are totally beholden and scared. It’s no wonder Mario Draghi “promises” the ECB will discuss lower rates and perhaps further ease. I fully expect to see more in the way of similar action from the PBOC and BOJ. The central banks are all in at this point. There is no turning back. They will continue this course right up to it predictable and inevitable destruction.
Warning Signals
So, I believe one of the key signals of the coming cycle change will be not only tracking data point anecdotes such as margin debt levels, but also the behavioral characteristics of the investment community. Can investors continue to indefinitely “dance” to the words and actions of central bankers, after 7 full years of those same words and actions having produced nothing of substance in terms of reinvigorating the global economy? Or will the focus shift to the increasingly visible slumping of the global economy and corporate revenues? So far the dancing continues, but the tune is getting old...
We all remember the words Chuck Prince (former CEO of Citi) wished he’d never uttered in 2007. “The music is still playing, so we’re still dancing.” For now, investors are still dancing to the music of central bankers globally. If this behavioral shift I'm looking for actually takes place, prices should react as Citi’s stock price did the day Mr. Prince found out the music had actually stopped. That is to say, plunge violently.
Bottom line: equity markets have not priced a meaningful slowdown in global corporate earnings. They are still pricing in central banker commentary…..for now. History teaches us that equity turbulence accompanied by meaningful economic softness often marks the turn from a secular bull market in to a bear market.
In Part 2: Why The Next Market Drop Will Likely Be 30-40% we look further into the alarm bells of caution the underlying economic data and technical analysis are now sounding. The messages of the moment are: 1) pay attention, this is absolutely no time for complacency, 2) if the charts do not revert back to technical health, do not be afraid to look like an idiot and be “too” conservative with capital, 3) market tops usually frustrate both the bulls and the bears…until they don’t. After that point, everyone is running for the same exit. One that few can make it out of in time.
Click here to read Part 2 of this report (free executive summary, enrollment required for full access)
This is a companion discussion topic for the original entry at https://peakprosperity.com/has-the-market-trend-shifted-from-bull-to-bear/
