Headwinds for Housing

It’s no secret that housing and employment are correlated, and the causation is intuitive. If more people have jobs, then more people have incomes that support the purchase of a home. In the other direction, the more houses that are built to meet rising demand, the more jobs will be created in construction and real estate.

We can see the correlation in this chart from the St. Louis Federal Reserve displaying one measure of employment for workers age 45-54 and the index of home prices.

As employment of those in their peak earning years rose, so did home prices. This is partly a function of basic supply and demand: Rising demand pushes prices higher.

As employment fell, demand declined, and so did home prices.

The Federal Reserve famously has a dual mandate: to maintain stable inflation and employment. The Fed attempts to pursue these goals with monetary tools such as setting interest rate targets, while the Federal government supports housing by subsidizing mortgage interest via tax policy and guaranteeing mortgages via the housing-lending agencies of Fannie Mae, Freddie Mac, and the Federal Housing Administration (FHA).

The Fed’s primary tool for stimulating demand for housing has been to lower mortgage interest rates, by buying the US Treasuries that set the baseline cost of long-term debt and also mortgage securities. Indeed, the Fed’s first quantitative easing (QE) program was to buy about $1 trillion in distressed mortgage debt outright. This removed the impaired debt from banks’ balance sheets and also served to lower mortgage rates.

The Fed’s assumption was that lower rates would stimulate demand for houses. As this chart illustrates, lower rates have stimulated precious little demand. 
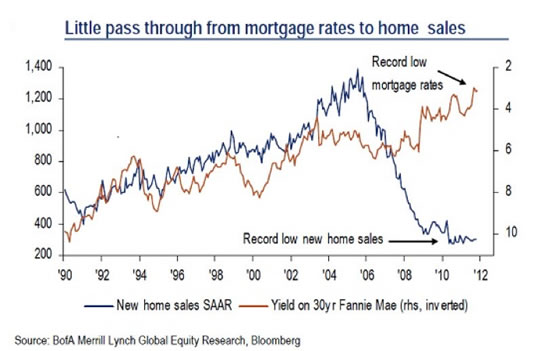
(Source)

Part of this failure can be traced to the decline in employment. Fewer people have the wherewithal to support buying a house. But demand is only part of the picture, as millions of foreclosures and defaults have created a huge overhang of excess supply that is estimated to number some 2.5 million homes.

What is not expressed in charts of mortgage rates, employment, and housing inventory is the implosion of housing as a speculative market. Millions of households bought more than one home as a speculative play; according to a recent report from the New York Fed, one-third of all home mortgages issued in 2006 were to people who already owned another home.

Millions of others bought homes with low down payments, while millions more added second mortgages or home equity lines of credit (HELOCs) to their existing first mortgages to extract equity. 

As a result, “owner equity as percentage of household real estate,” as measured by the Federal Reserve, has fallen from 60% in 2005 to a mere 38.6% in the third quarter of 2011. When we consider that roughly one-third (33%) of all homes in the US are owned free and clear (i.e., have no mortgage), then we can see that equity in the remaining two-thirds with mortgages is a razor-thin 5%-6%.

Interestingly, despite millions of foreclosures and write-downs, mortgage debt has actually risen from its 2006 level of $9.86 trillion to $9.93 trillion in the third quarter of 2011. (So much for deleveraging.) The “ForeclosureGate” MERS/robo-signing scandal is another systemic wild-card in the housing deck that is has created a legal logjam in the foreclosure pipeline. Since no one can predict the eventual resolution of this logjam, we will set it aside, noting it as an additional impediment to the clearing of the housing market.

With this dramatic contraction of equity in mind, it is understandable that 10.7 million (22%) of all homeowners with a mortgage are “underwater” -- that is, they owe more on their mortgage than their home is worth, while another 5% have negligible equity.

Another aspect of the Fed’s failure to boost demand by lowering rates results from the Fed’s misunderstanding of how risk is priced when interest rates are kept artificially low via official intervention and manipulation. If we place ourselves in the shoes of a mortgage issuer, we realize that artificially low rates deprive the lender of a means to price risk. In an open, transparent market, interest rates rise and fall according to the perceived risk that the borrower might default and/or the asset underlying the loan might decline substantially in value.

In the current housing market, falling prices make it clear that there is still downside risk of homes declining further in value going forward. Furthermore, the unstable employment environment means that a household could shift quickly from low-risk to high-risk if the principal breadwinner's job was lost and could not be replaced.

Since rates have been artificially suppressed to goose demand, lenders have no way to compensate for the risk of issuing a mortgage except to insist on very substantial down payments or to simply avoid lending to all but those with the very best credit scores.

Anecdotally, this is precisely what we see happening. Households that easily qualified for jumbo mortgages in the boom years are being turned down for refinancing mortgages. From the point of view of the mortgage issuer/lender, why take a chance of massive future losses for a paltry 4% interest rate?

The tragic irony of the Fed’s policies of buying impaired mortgage debt and suppressing mortgage rates is that this has impeded the market from properly pricing houses, mortgages, and risk. And when the price of assets, debt, and risk cannot be discovered by transparent market forces, then participants must remain wary of future price discovery.

In other words, manipulating and impeding the market only increases the risk, driving the risk-averse out of the market. That leaves only the reckless in the housing market — those plunking down 3% for an FHA-backed mortgage and those lenders who have transferred the risk of default to the Federal agencies: Fannie, Freddie, and FHA.

This “moral hazard” — the separation of risk from gain/loss — leaves the taxpayer on the hook for not only making good the staggering losses already recorded by Fannie Mae and Freddie Mac, but also for future losses in mortgages backed by FHA, which has seen its mortgage portfolio explode from 3.8 million to 5.7 million in just the past two years. As anyone could predict when down payments get as tiny as 3%, a slide in home values of a few percentage points can easily put the homeowner underwater, and consequently the default rate on FHA mortgages has been rising.

With a paper-thin supplemental cash reserve of $2.6 billion supposedly backing up its $1.1 trillion mortgage portfolio — a mere one-quarter percent of the portfolio -- FHA will soon need a taxpayer-funded bailout in the billions of dollars to keep afloat.

The Federal Reserve and the Federal government have attempted to boost the housing market’s demand and valuations by introducing moral hazard on a vast scale and by making it impossible for the open market to discover the price of housing, mortgages, and risk. Prudent lenders and buyers have been forced by this systemic risk to withdraw from the market, even as artificially low mortgage rates, near-zero down payments, and government-backed mortgages have created generous incentives for the most reckless buyers and lenders to take their chances. After all, if you can’t lose more than 3% by buying a spot on the real estate roulette wheel, and all mortgage losses will be made good by the taxpayers, then why not gamble? 

In this manipulated market, the reckless have nothing to lose, while the prudent cannot possibly assess the real risk or price of assets and debt. The grand irony is that in attempting to “save” the housing market by suppressing mortgage rates and the market’s discovery of the price of homes, debt, and risk, the Fed has systemically crippled the housing market.

There is a subtext to the Fed’s fervent intervention in the mortgage and housing markets: By propping up housing prices, it also props up the sagging balance sheets of its favored (and politically powerful) “too big to fail” banks. From this perspective, we can see that the Fed’s public concern for employment masks its real concern, which is keeping the “too big to fail” banks from a market recognition of their insolvency.

When will the housing market “recover”? Housing can only find solid footing if the market is freed to discover the prices of property, mortgages, and risk. Until then, the market will drift along in a haze of moral hazard and official support of the imprudent and reckless.

In Part II: How Low Will Housing Prices Go?, we explore the macro-economic trends likely to further depress housing prices in the coming years, as well as look at several time-tested models for determining how much downside is left for housing prices and how we'll be able to estimate when the housing market finally reaches a bottom.

Click here to access Part II of this report (free executive summary, enrollment required for full access).

This is a companion discussion topic for the original entry at https://peakprosperity.com/headwinds-for-housing-2/

I know that other users have complained about this in the past, but I feel that I have to echo them.  With greatest respect, I will suggest that Charles Smith’s work would be more valuable if he would take more care in the presentation of data and facts.
If the purpose of data is not merely to sprinkle an argument with an air of mathematical certainty - if its purpose is to actually enable a reader to follow the basis of an argument - then it must be presented with care.  Failing to make the small additional effort to properly present data gives the impression that the author doesn’t really care about the data.  Worse, spotty data can be one of the warning signs of an argument that is not born in facts, but which merely draws upon facts when convenient to support the conclusion. I’m sure that this argument is not among those, but it is still unsettling to a reader.

[quote=Charles Hugh Smith] [O]wner equity as percentage of household real estate, as measured by the Federal Reserve, has fallen from 60% in 2005 to a mere 38.6% in the third quarter of 2011. When we consider that roughly one-third (33%) of all homes in the US are owned free and clear (i.e., have no mortgage), then we can see that equity in the remaining two-thirds with mortgages is a razor-thin 5%-6%. [/quote] This will only be true if those houses (presumably older houses) without mortgages have the same average value as those homes with mortgages.  Well do they?  Smith presents no data to substantiate that conclusion, yet claims that "we can see" that the equity in the remaining homes is 5-6%.  I don’t understand; why waste all the effort building a statistical argument if one of the wheels is missing?
At another point in the piece, referring to CHART 1, Smith says, [quote=Charles Hugh Smith] We can see the correlation in this chart from the St. Louis Federal Reserve displaying one measure of employment for workers age 45-54 and the index of home prices.[/quote]  It would be nice to know which measure of employment he is referring to.   Who compiles that measure?  And since neither data set is clearly labelled on the chart, the curious reader will have to google both "LN512000093/POPTHM" and "USSTHPI" to try and figure out which one of them might have something to do with employment.
The busy reader should not have to Google "LN512000093/POPTHM" to try and figure out where data is coming from!
I wouldn’t bring this up if Charles Smith wasn’t making thoughtful arguments.  They are thoughtful and deserve to be well supported.  But this habit of being just a little bit careless with data (like being a little bit late for work every morning) is a pattern with this particular author.  It could easily be improved upon, and would in my opinion greatly improve the quality of the finished product.

I’m surprised that the vast majority of people are ignorant about the effects of the 45-54 demographic. Even though they feel it by the seat of their pants intuitively, part of the reason that people don’t understand that we’re in a Greatest Depression is that people don’t understand the tremendous effect that the 45-54 years olds have on the economy.   Having the baby boomers flooding into that spending category created a tremendous boom for the US economy.   Coupling that with easier and easier debt creation created an artificial prosperity bubble that was predictably untenable and going to end with a large bang.   All of the financial excesses that should have accumulated during the Clinton and Bush years were effectively pissed away.   Those were the last of the "boom years" for quite a while.   We propably won’t see tax receipts like that for a long while.  Not in real terms anyway. 
Unfortunately, the number of people in that critical demographic drops like a rock going forward and so will all of their spending.  It’s not so much that they’re retiring and absorbing scarce retirement resources, it’s that they simply won’t be doing the heavy duty spending any more.  We’re going down the same path as Japan did 20 years ago for much the same reason. 
The good news is that there is light at the end of the tunnel.  The bad news is that it is a long tunnel until the light.  
After we pass 2012, it’s going to be an interesting time.  In more ways than one!   This is a graph of the stock market vs. the 45-54 year old demographic population.   It’s pretty consistent.   But the other thing that has happened during the 1980 to now period is the creation of a debt  bubble that will ultimately have to be burned off one way or another.     
Our children are going to bear a burden unlike any of their previous ancestors.  But I’m confident they’ll be up to the task. They’ll also have the leverage of an unprecedented technology boom that still has to unfold yet after the havoc it’s creating during it’s early stages.   It’s all happened before, the difference is that now it’s happening to us.  We’ll do more with less and we’ll still live a higher standard of living than anyone before us.  What was 20 miles per gallon will become 200 miles per gallon.  
Alan Kauth
Intero Real Estate Services
www.FieldOurDreams.com

There is also an error in calculation.  For now, let’s ignore the average value of homes with no mortgage issue.  We have 2/3 (67%) of houses with equity equal to 5.3% of the value of all houses.  To compute the actual equity, we need to divide 5.3% by 67% which is about 8%, not 5-6%.  Not a huge error, but still a bit sloppy.
Charles, if these types of errors are hard to see in your own writing, perhaps you could have someone with a good mind for math read through it before it is published to the web.

Thank you for the correction Steve, and JRF for highlighting the importance of data and sourcing.  I make no excuse and will make a more concerted effort in future calculations.  I agree JRF readers shouldn’t have to google the data ID and I will make sure to describe the data series on future charts.
Yes, the actual value of the homes owned free and clear is not available, at least through any data source I have been able to find, but we do have some indicators of age and locale, for example:

http://www.calculatedriskblog.com/2011/08/lawler-census-2010-homeownership-rates.html

While there may be a standard distribution of free-and-clear homes within the entire universe of homes, it seems more likely to me that free-and-clear homes would be skewed to the more valuable homes and to older homeowners who have paid off their mortgages over 30 years.  The wealthiest segments of the population may well have as many mortgages per capita as the less wealthy, but anecdotally those people I know who own their homes free and clear are well-off and prudent (the two not necessarily being correlated, of course, in every case).

While it is important to ‘do the math’, the charts speak for themselves, and the primary point here is that the value of housing is correlated to employment trends.  The questions about calculations (modest differences that are essentially statistical noise) and labeling of data do not challenge the basic contention here which is that housing cannot rise in value unless employment is supportive of that trend.

Charles,
Thank you for taking time to read these comments.  Your articles are always a pleasure to read. [quote=Charles Hugh Smith] While it is important to ‘do the math’, the charts speak for themselves, and the primary point here is that the value of housing is correlated to employment trends.  The questions about calculations (modest differences that are essentially statistical noise) and labeling of data do not challenge the basic contention here which is that housing cannot rise in value unless employment is supportive of that trend.[/quote] No doubt about that.  Your conclusions seem unassailable to me, which is the only reason why I, as a reader, would be interested in delving into the underlying data.  Thank you for your incisive analysis.

No this isn't a scam, and yes I understand if you think it is, but I can assure you it isn't a scam.....


Come over to my website and I will show you a "secret" about the Oil market which will allow you to make $200 to $5,000 per day taking only a few trades per day.


Sound too good to be true? Of course it does, it sounds like "snake oil" talk, believe me I do understand, however, if what I say be the truth, how else am I suppose to describe it? Should I lie? Come visit me at my website “Gold Trading Academy”....


I think not, for it is the lie which I hate, even if that lie be the way to make money....


Tell me, is it our fault the lie exists to begin with? Did we make the lie? No we did not, and in fact we are all victims of this lie, which in fact is much broader then the lie I teach (secret) at my website "Gold Trading Academy"....


So I ask you then, is it wrong for us to know of this lie? And if we do know, is it wrong for us to take advantage of it financially?


I think if you knew and understood the broader lie, and realize the matrix we live within, you would understand and hopefully agree that so long as you use what you're given for good, then I think it must be alright.


If you agree with me then I offer you the truth at my website "Gold Trading Academy".....


Join the revolution....

Per Sero Hedge at http://www.zerohedge.com/news/existing-home-sales-debacle-larry-baghdad-bob-yun-confirms-overstatement
"In what can only be described as completely unsurprising, Larry Yun of the National Association of Realtors (NAR) has admitted, according to CNNMoney, that maybe possibly they overstated, purely by accident, the number of existing homes sales statistic that has formed the cornerstone of his constant corner-turning commentary over the past few years. We have unequivocally challenged the Ph.D.'s claims as fudged and fabricated this year and even the Wall Street Journal, back in February of 2011, saw ‘challenges’ in the NAR’s data when compared to other unbiased sources of the same reality. We can only assume that when Yun explains, in true Baghdad-Bob-style, the adjustments (when they are released on December 21st) that they will be either a signal that the bottom is in for home sales or that from such a low base, things can only get better."

 - Safewrite

Where are you getting the 5.3% equity number for the 67% of houses with a mortgage?

The price of essential oil while in the subprime crisis, below the effect of true religion women jeans, the cost is low, durable, effortless to fit the product true religion store sales than last yr the corresponding time period grows 4.9% inside the usefulness characteristics. even although high-end brands, for example true religion denim Citizensof human being and Joe “as a leader, the sJean for all mankind correct religion, seven, however the checklist is additional than $100.
The only producer brand workSurvey exhibits that our female purchasers every sole jeans $24.50 to $22.91, increased than last year’s cheap jeans the true religion common prices. LeviStrauss encounter trouble this year, significant essential oil expenditures and foods expenditures in Asia Europe industry development actions inside the slowdown in first.

The decline in product sales LeviStraussSignature buy true religion Levi strauss 7 in existence, but while in the right, although wal-mart and concentrate on large chain store product sales also allow additional discount true religion purchasers common brand. Two OldNavy, sword inside the brand new design and design director below the producer inside the increase of ToddOldham brought additional stylish true religion jeans outlet.