Here's Why The Markets Have Suddenly Become So Turbulent

When stock markets are free-falling 10+% in a matter of days, it’s natural to seek some answers to the question “why now?”

Some are saying it was all the result of high-frequency trading (HFT), while others point to China’s modest devaluation of its currency the renminbi (a.k.a. yuan) as the trigger.

Trying to finger the proximate cause of the mini-crash is an interesting parlor game, but does it really help us identify the trends that will shape markets going forward?

We might do better to look for trends that will eventually drag markets up or down, regardless of HFT, currency revaluations, etc.

Five Interconnected Trends

At the risk of stating the obvious, let’s list the major trends that are already visible.

The China Story is Over

And I don’t mean the high growth forever fantasy tale, I mean the entire China narrative is over:

  1. That export-dependent China can seamlessly transition to a self-supporting consumer economy.
  2. That China can become a value story now that the growth story is done.
  3. That central planning will ably guide the Chinese economy through every rough patch.
  4. That corruption is being excised from the system.
  5. That the asset bubbles inflated by a quadrupling of debt from $7 trillion in 2007 to $28 trillion can all be deflated without harming the wealth effect or future debt expansion.
  6. That development-dependent local governments will effortlessly find new funding sources when land development slows.
  7. That workers displaced by declining exports and automation will quickly find high-paying employment elsewhere in the economy.

I could go on, but you get the point: the entire Story is over.  (I explained why in a previous essay, Is China’s “Black Box” Economy About to Come Apart? )

This is entirely predictable. Every fast-growing economy starting with near-zero debt and huge untapped reserves of cheap labor experiences an explosive rise as the low-hanging fruit is plucked and the same abrupt stall and stagnation when the low-hanging fruit has all been harvested, leaving only the unavoidable results of debt-fueled speculation: an enormous overhang of bad debt, malinvestment (a.k.a. bridges to nowhere and ghost cities) and policies that seemed brilliant in the good old days that are now yielding negative returns.

The Emerging Market Story Is Also Done

Emerging currencies and markets have soared on the back of the China Story, as China’s insatiable demand for oil, iron ore, copper, soy beans, etc. drove global demand to unparalleled heights.

This demand pushed prices higher, which then pushed production (supply) higher, as the low cost of capital globally enabled marginal resources to be put into production with borrowed money.

Now that China’s demand has fallen off—by some accounts, China’s GDP is actually in negative territory, despite official claims that it’s still growing at 7% annually—commodity prices have crashed, taking the emerging markets’ stock and currency markets down. (Source)

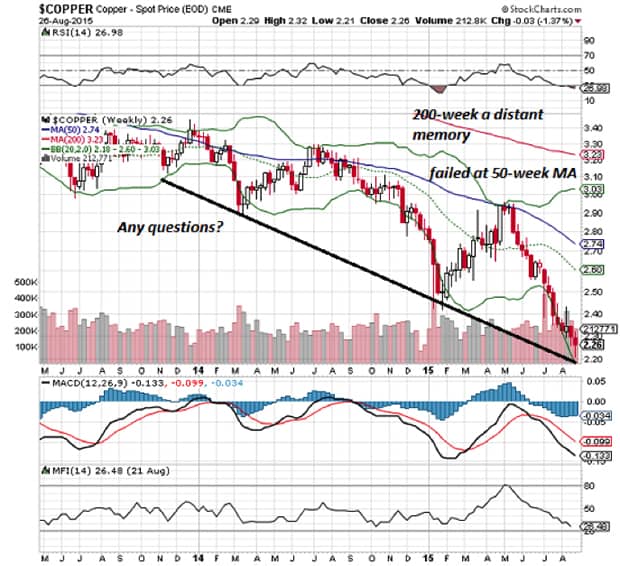
Here is a chart of Doctor Copper, a bellwether for industrial and construction demand:

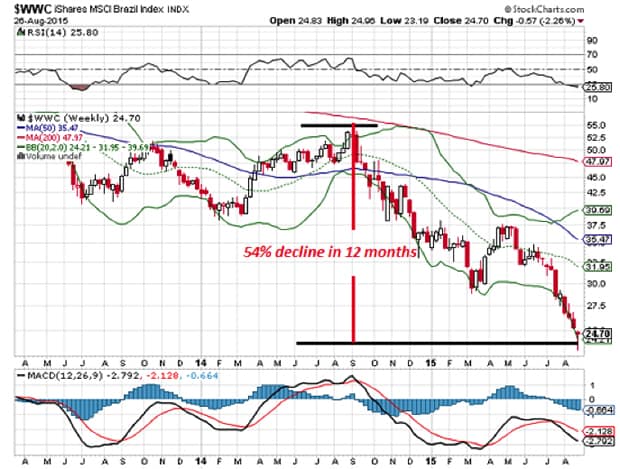
Here is Brazil’s stock market, which has declined 54% in the past 12 months:

These are catastrophic declines, and with China’s growth story over, there is absolutely nothing on the global horizon to push demand back up.

Diminishing Returns on Additional Debt

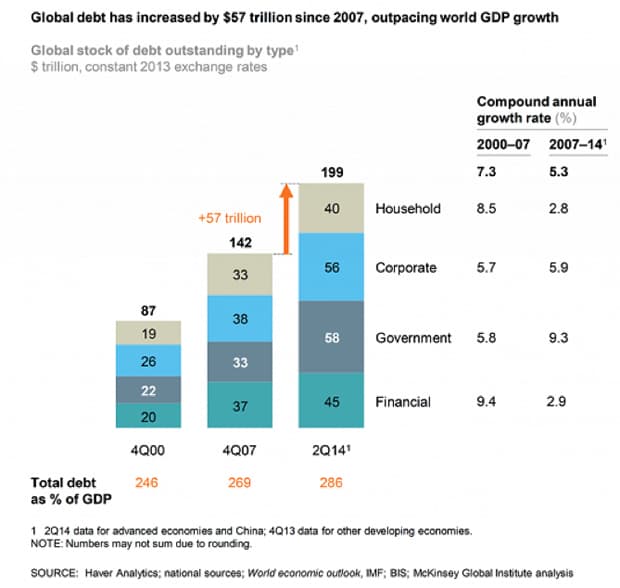
The simple truth is that expanding debt has fueled global growth. Though people identify China as the driver of global demand for commodities, China’s growth is debt-driven. As noted above, China quadrupled its officially tracked debt from $7 trillion in 2007 to $28 trillion as of mid-2014—an astonishing 282 percent of gross domestic product (GDP).  If we add the estimated $5 trillion of shadow-banking system debt and another year’s expansion of borrowing, China’s total debt of $35+ trillion is in excess of 300% of GDP—levels associated with doomed to default states such as Greece and Spain.

While China has moved to open the debt spigot in recent days by lowering interest rates and reserve requirements, this doesn’t make over-indebted borrowers good credit risks or more empty high-rises productive investments.

Borrowed money that poured into ramping up production in emerging nations is now stranded as prices have plummeted, rendering marginal production intensely unprofitable.

In sum: greatly expanding debt boosted growth virtually everywhere after the Global Financial Meltdown of 2008-2009. That fix is a one-off: not even China can quadruple its $35+ trillion debt to $140 trillion to reignite growth.

Here is a sobering chart of global debt growth:

Limits on Deficit-Spending (Borrowed) Fiscal Stimulus

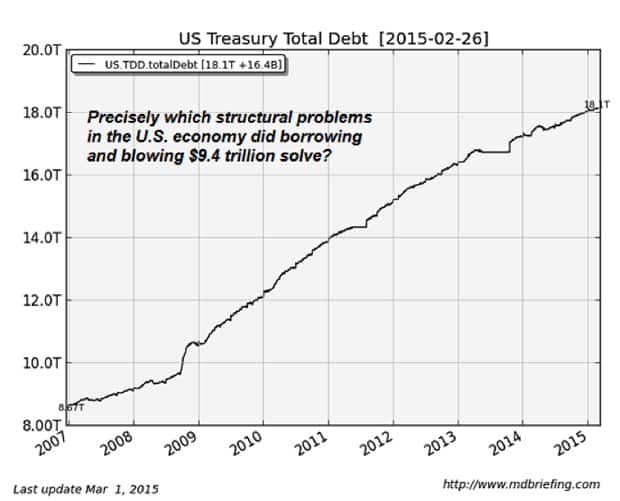
When the global economy rolled over into recession in 2008, governments borrowed money by selling sovereign bonds to fund increased state spending.  In the U.S., federal borrowing soared to over $1 trillion per year as the government sought to replace declining private spending with public spending.

Governments around the world have continued to run large deficits, piling up immense debts since 2008.  The global move to near-zero yields has enabled governments to support these monumental debt loads, but even at near-zero yields, the interest payments are non-trivial. These enormous sovereign debts place some limits on how much governments can borrow in the next global recession—a slowdown many think has already started.

Here is a chart of U.S. sovereign debt, which has almost doubled since 2008:

As noted on the chart: what structural inadequacies or problems did governments fix by borrowing gargantuan sums to fund state spending?  The basic answer is: none. All the same structural problems facing governments in 2008 remain untouched in 2015. These include: over-indebtedness, bad debts that haven’t been written down, insolvent banks, soaring social spending as the worker-retiree ratio slips below 2-to-1, externalized environmental damage that has yet to be remediated, and so on.

Central Bank Stimulus (Quantitative Easing) as Social Policy Has Been Discredited

In the wake of the Global Financial Meltdown of 2008-2009, central banks launched monetary stimulus programs aimed at pumping money into the economy via bank lending. The stated goals of these stimulus programs were 1) boost employment (i.e. lower unemployment) and 2) generate enough inflation to stave off deflation, which is generally viewed as the cause of financial depressions.

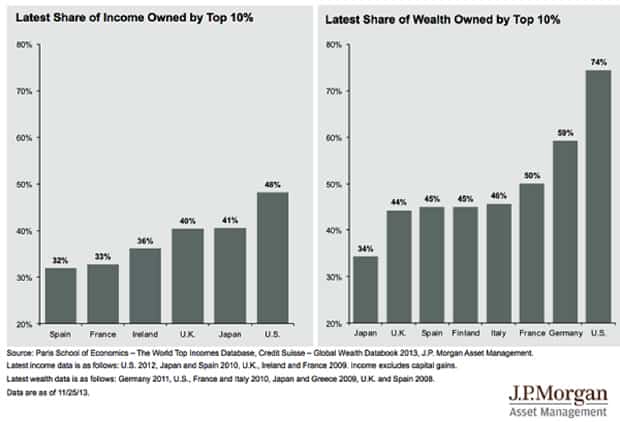
While it can be argued that these unprecedented monetary stimulus programs achieved modest successes in terms of lowering unemployment and pushing inflation above the zero line, they also widened wealth and income inequality.

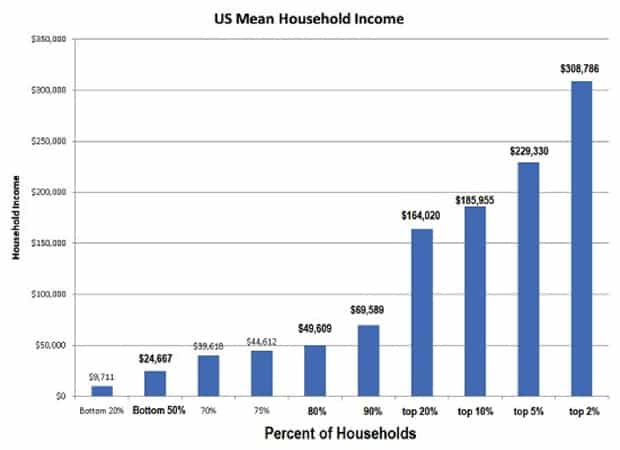
Even as these programs made modest dents in unemployment and deflation, they pushed asset valuations to the moon—assets largely owned by the few at the top of the wealth pyramid.

Here is a chart of selected developed economies’ income/wealth skew:

The widespread recognition that the benefits of central bank stimulus mostly flowed to the top of the pyramid places political limits on future central bank stimulus programs.

The 2008-09 Fixes Are No Longer Available

In summary, the fixes for the 2008-09 recession are no longer available in the same scale or effectiveness.  Expanding debt to push up demand and investment, rising state deficit spending, massive monetary stimulus programs—all of these now face limitations. This means the central banks and states have very limited tools to reignite growth as global recession trims borrowing, investment, hiring, sales and profits.

What Ultimately Matters: Capital Flows

In Part 2: What Happens Next Will Be Determined By One Thing: Capital Flows, we’ll look at the one dynamic that ultimately establishes assets prices: capital flows.

I personally don’t think the world has experienced a period in which capital preservation has become more important than capital appreciation since the last few months of 2008 and the first few months of 2009.  Other than these five months, the focus has been on speculating to obtain the highest possible yield/appreciation.

This suggests to me that the next period of risk-off capital preservation will last a lot longer than five months, and perhaps deepen as time rewards those who adopted risk-off strategies early on.

Click here to read Part 2 of this report (free executive summary, enrollment required for full access)

This is a companion discussion topic for the original entry at https://peakprosperity.com/heres-why-the-markets-have-suddenly-become-so-turbulent/
they pushed asset valuations to the moon—assets largely owned by the few at the top of the wealth pyramid.
This caught my eye. I can understand the need to have access to land to grow food but if the assets are leveraged and distressed they will be worth whatever the market will bear. I am reminded of a house being sold for a dozen eggs in the Weimar. Or the hotel being sold to the bell hop for an oz of gold. 

I see a lot of expensive toy yachts being polished up in anticipation of the Big Sale here in the marina. The difference between my yacht and theirs is that mine is an asset and theirs are liabilities. Mine saves  me money (invisible earnings) and theirs costs them money. 

And I don’t mean the high growth forever fantasy tale, I mean the entire China narrative is over:
Man.  That's interesting.  You sure put a stake in the ground.

You're saying they recap Japan and Russia, the two command economies that finally hit their limits.  This I've always believed, but the interesting thing  is, you are saying this is happening now, and that's because of debt growth limits.

I'm always nervous about picking the tops on such places, since I'm always worried they'd have one more spike left in them to hose the shorts like me.  That, and their command structure knows this is the danger, since they saw what happened to Japan.

Is this one of these inevitable outcomes driven by unavoidable systemic effects?  Even though the leadership knows full well what needs to change, perhaps the entrenched interests will fight tooth and nail to keep things in place - Hari Seldon's force of psychohistory effectively overwhelming the efforts of the individual actors, as it were.

Steve Keen has been making the rounds on the China story recently.  His claim is that when the rate of debt growth declines, it results in an effective drop in the spending power of the country, which results in a very predictable recession.  Turns out, this is simple math.

If your economy is 1 trillion, your debt is 2 trillion, and your growth rate of debt is 25%, GDP growth is 10%, the debt growth adds 500 billion to your GDP for that first year.  If in year two, your debt growth drops to 5%, your economy is 1.1 trillion, your debt is 2.5 trillion, but the debt growth is only adding 120 billion, not 500 billion, which ends up being a net "cut" of 380 billion for the year from what was expected.  Cut 380 billion from a 1.1 trillion economy, the economy just craters.

And that IS what is happening to China right now.  Debt growth has been cut way back, and so a contraction is unavoidable.  As soon as they stop running the Red Queen's Race, they fall off the back of the treadmill.  To mix a metaphor.  Here's a chart of M2 year over year growth - its not loan data, which unfortunately I can't get, but money supply does follow loan growth, so I think its a reasonable approximation.  An economy that is structured for a 17% annual growth in money now only gets 9.6%.  According to Keen's simple math, that ends up in a guaranteed slowdown.


Davefairtex, thank you for the excellent chart and commentary. This chart shows the absolute explosion of debt authorities unleashed in 2009 to counter the effects of the Global Financial Meltdown. It also shows the spike down in 2011 that coincided with global weakness and stock market declines.
Izabella Kaminska (writer for the Financial Times) recently described the problem of funding local govt. in China that I mentioned in my previous series on China's fundamental problems. Once land development slows, local governments lose their primary source of revenues.

That kind of thing tends to act as a financial domino, as all the spending that flows from local govt. expenditures dries up and blows away.  the problem is there is no structural substitute waiting in the wings.

This is anecdotal, but interesting: http://www.theguardian.com/world/2015/aug/27/china-small-time-recyclers-down-on-their-luck-amid-stock-market-turmoil

China's workers abandon the city as Beijing faces an economic storm


Nassim Taleb  made out big by backing his own horse. He said that unlikely events happen frequently. So his team dribbled money into shorts for a very long time making losses all the way.
And then he had his moment.

http://www.zerohedge.com/news/2015-08-28/nassim-talebs-fund-made-1-billion-monday-how-other-hedge-funds-did

Chaos theory supports him.  These things are not smooth and continuous. 

Aloha! Many mahalos Charles for your report! You have to consider "quality" of debt for sure. Right now I do not believe there is much "quality" at all as I believe global governments are spending huge quantities to preserve political power. How do you keep your population from rioting? First goal is to make sure the masses have food to eat as nothing ruins political power bases like angry starving mobs!
A chart of China credit growth from the WSJ shows a definite trend no matter how low interest rates are.

There's a number that nobody can believe in! What government doesn't fudge GDP? Now what indeed?

When the US government spends on Social Security and EBT Walmart profits and so does China since a number of Walmart products are made in China. I suspect the same holds true for all other Western governments as well. Given the US Congress spends more than it takes in tax revenues every year US Debt is being exported to China via a portion of Walmart imports.

This is the problem of BIG government in that quality of debt, meaning quality of spending, goes out the window as political obligations to the largest donors and interest groups take precedence over rational long term economic planning. The short sighted preservation of power of the status quo becomes paramount over the long term economic stability. Of course where in history is there any long term economic stability once politics owns the means of production? 

To further seal the deal and make the US Fed governors US economic viability theory a mute point all you have to do is follow the NFIB. In the latest NFIB Optimism Index they sum it up in one sentence.

The Small Business Optimism Index rose 1.3 points to 95.4, which has produced the most grudging gains in the Index's history and still not above the 42 year average of 98.

What two most pressing problems are still at the top of the average Small Business owners list? What else …

1-Government Red Tape

2-Taxes

Furthermore in terms of credit US Small Business owners reported in July that their credit needs were 4% not satisfied, a historical low. Even with the lowest interest rates in history US Small Business doesn't even need loans because the future is so uncertain thanks to Congress and the US Fed. Why take out a five year loan when you're not even sure you'll be in business in a year? Same goes for consumers. You have to have some super job security to take out a 30 year mortgage these days!

Clearly the old idea that China plans for the long term is out the window. In order to retain power BIG government never has that luxury. Who knows this more than politicians. I see nothing on the horizon coming from Congress or the markets that would make CAPEX return on a global scale. We are in a period of deflationary hurdles. It is too bad the US Fed did not listen to Small Business, but even then a central bank will always favor its member banks. What else can you expect from a corrupt banking system?

Meanwhile, here in Hawaii we are facing two major hurricanes back-to-back. Honestly, I much prefer a government "like a hurricane". It comes in blows and goes. No career Cat 4 politics! What we have now is continual long term Cat 4 politics that blows debt and corruption to every crevice of society until the economy is completely destroyed. Congress survives but nobody else does! That's not a world even the 1% want to live in!

I can't crunch charts with the big dogs, but I swear if I ever meet you in person I'm buying you two rounds, for:

  1. Saying Charles "put a stake in the ground," which made me snort wine out of my nose. Having read much of his stuff, I think he excels at it. In fact, should there ever be a vampire apocalypse, I'm heading for where ever he is, as he must own a stake factory.

  2. Hari Seldon reference for the win! The Foundation Trilogy was hands-down my favorite science fiction series of all time, and I rarely ever hear anyone else refer to it.

Ok, carry on with the economic talk. I'll be over here in the corner. /points to the far side of the room


Oh, and excellent article Charles!

Why is government debt included in the debt columns? That is wrong
Government debt is the sum of treasury securities held in the Central bank, the FRB.

Treasury securities are savings accounts. National debt should read National capital.

The reality should change to "the bigger the number of T-Securities the wealthier will be the nation"!


An oldie, but a goodie…


ejhr… your comment reads like something out of the onion;

Why is government debt included in the debt columns? That is wrong

Government debt is the sum of treasury securities held in the Central bank, the FRB.

Treasury securities are savings accounts. National debt should read National capital.

The reality should change to "the bigger the number of T-Securities the wealthier will be the nation"!

So you are saying the Treasuries held by China, Japan, in my 401K funds, etc., and not US debt?  Only those bought with QE unbacked money.. those held on the FED balance sheet, are actual debt? (odd..because these feel kinda less, "debty" than the others to me).  I like your conclusion... and the total lack of negative consequences due to increasing debt.         


I just want to point out the following;
2012 China M2 = ~85B CNY,  17% growth on this = 14.5B CNY

2015 China M2 = ~135B CNY,  9.6% growth on this =  13B CNY

In a compounding, exponential situation, a 17% growth rate is pretty out of control.  The fact is the actual amount of new money pumped in this year at the lower effective growth rate is not too far off what was was thrown off in 2012.  China just cut rates too… 

I am not trying to defend China or say they are not slowing down… they most certainly are.  Just that 9,6% is a long, long way from zero, and 13B is a lot like 14.5B… that's not deflation.       


Data ref;  http://www.tradingeconomics.com/china/money-supply-m2

Thank you very sincerely for the kind words and the good laugh–which is so rare when we're discussing all this financial-economic stuff.
I am also a big Foundation Trilogy fan–and why oh why can't I find the software program out there that predicts the future of the stock market?   With future history mapped out, I could amass a fortune and buy a stake factory…

FWIW, Foundation is a photo-finish second place to Lord of the Rings for me.

Anyone care to venture a guess at who "The Mule" is?

JimH-
Keen's work clearly shows that once a growth rate is in place for any length of time, the economy structures itself to expect said growth rate.  Once removed - or even curtailed - its going to result in a slowdown.  Like we are seeing now.  More curtailing, more slowdown.

What's more, a comparison with 2012 is not as useful as you might hope.  In order to understand the impact on China in 2015, you need to compare with 2014.  (2012 was "so three years ago").

The thing I found fascinating about Keen's math is that it is counterintuitive.  You would expect any debt growth to result in a happy outcome - if just somewhat less happy - but that's just not true.  Any reduction in that rate will impact GDP, even if the reduction in the rate still leaves the rate greater than zero.

Chopping the rate in half ends up being contractionary, because China's debt/GDP ratio is so high.  Wacky, but true.

Here is Steve Keen's original work: http://www.forbes.com/sites/stevekeen/2015/08/26/why-china-had-to-crash-part-1/3/

Principle is, debt growth = additional spending over baseline GDP = adds directly to GDP.

It is year 3 that corresponds to where China is today.  In year 1 & 2 the debt growth is 25% per year, which adds $350B and $437B respectively to GDP.  In year 3, debt growth is only 10%, which adds only $218B - which is a reduction of new spending of $221B for that year = lower GDP = contraction.

China might not be exactly at -6%, but they sure aren't at 7%, and they might even be at 0%.  And changes in debt growth is at the heart of the problem.

Not sure what the fix is, except perhaps not to have gone nuts in the first place.

GDP is a meaningless mathematical construction that is only important because a bunch of algorithms and self-deluded fools have convinced themselves that a few digits exiting misconstrued mathematical equations, with massive unreported error bars, purporting to measure who knows what, and manipulated into complete fantasy, report the tune that the real world marches to. Debt as GDP? It is robbing Peter to pay Paul, not the product of anything but mismanagement. Want to improve the economy of California? Have the San Andreas fault drop the 'big one' on San Francisco. Losing the city costs GDP nothing but rebuilding it inflates everything. Hey, let's all throw rocks through each other's windows and spur the economy… Your loss is the country's gain.
What China and the world are running into is the limits and unintended consequences of their fabrications. GDP was a flawed metric even before it was perverted. It is nothing more than an abstraction of economic reality that is used as a crutch because no one really understand the complex system that has been created. Who wants to wade through the real economy when you can use such a convenient number like 2.3%. It is another part of the 'con'fidence game that is the global economy. One number to rule them all… The way in which our gurus of global finance worship this little number of negative information value would be comical if it weren't so tragic for every living thing on the planet. These people would do much better to embrace some humility and contemplate the calculation of '42' (nod to Douglas Adams) and what it means.

The models or your lying eyes? 
Psychiatrist Dr.  Iain McGilchrist argues that this obsession with our models is a pathology.  It is as though we made an evolutionary leap in the Enlightenment and instead of just reacting to the world, the more successful breeders discovered mental models.  (I blame the Church. They trained everyone to believe a dubious model in the face of a brutal reality.)

The issue is, will our obsession with our models be a successful strategy or lead to our extinction? Or has evolution a surprise in store for us? 

I must point out that not all peoples of the world were subject to the European Enlightenment, and hence see the world differently. Those of us who bask in the warm glow of our culture and civilization are as oblivious to this as is a fish to the water in which it swims. 

I humbly present this model for your consideration. 

https://youtu.be/dFs9WO2B8uI

I too have to leave economics to you valued heavy hitters as it hurts my head. Dryams video reached the part that hurt and I loved it and Arthur's video explained brilliantly why I needed to laugh at Dryam's. Thanks fellows!


Zerohedge just posted these charts and I wanted to do something simple math to predict the next few years based on the growth pattern of the unemployment rate. Basically in just over two years another 3% of the US population will probably not have a job.4

For perspective, 10 million people is more than the population of New York City…