Is This Decline The Real Deal?

Is this stock market decline the "real deal"? (that is, the start of a serious correction of 10% or more) Or is it just another garden-variety dip in the long-running Bull market? Let’s start by looking for extremes that tend to mark the tops in Bull markets.

Extremes Eventually Revert to the Mean

There's little doubt that current measures of valuations, sentiment, leverage and complacency have reached historic extremes. Many analysts have posted charts depicting these extremes, and perhaps the one that distills well multiple extremes into one metric is Doug Short’s chart of the S&P 500’s inflation-adjusted Regression to the Trend, another way of saying mean reversion or reverting to the mean.

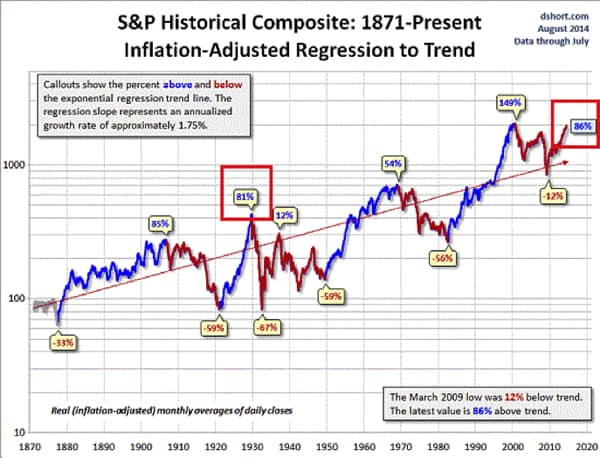
I have added two red boxes: one around the peak reached just before the Great Crash of 1929 (81% above the trend line), and one around the current reading (86% above the trend line).

That the current reading exceeds the extreme that preceded the Crash of 1929 should give us pause. And little comfort should be taken that the bubble of 2000 reached even higher extremes, as that should likely be viewed as an outlier rather than the harbinger of the New Normal.

What this chart demonstrates is the market tends to overshoot to the upside or downside before reversing direction and once again reverting to the mean.  Other than a very brief foray below trend line in 2009, the S&P 500 has been at or above the trend line for the past 20 years. While the Gilded Age boom of a century ago stayed above the trend line for over 30 years, more recent history suggests that markets that stay above the trend line for 20 years are getting long in the tooth.

Extremes in Risk Appetite and “Risk-On” Asset Allocation

One measure of risk appetite is junk bond yields, which as Lance Roberts shows in this chart, have reached multi-year lows:
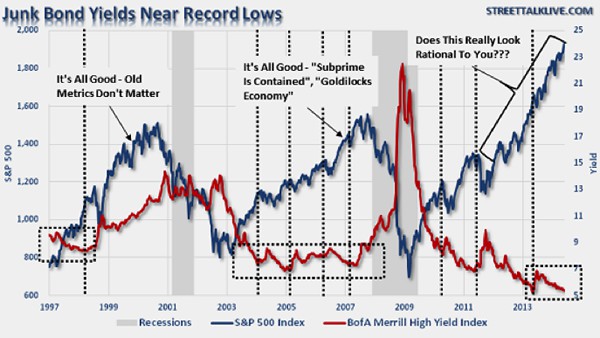
(Source)

Money managers’ appetite for the “risk-on” asset class of equities is similarly lofty:

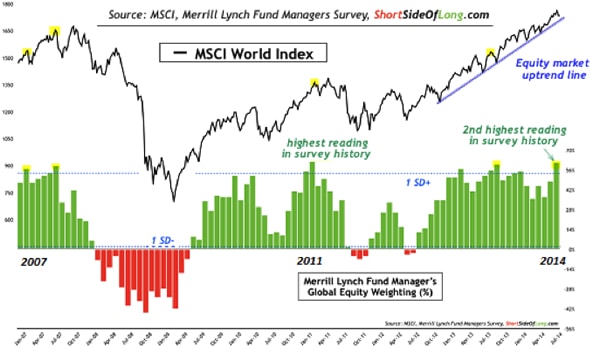
Previous readings near the current level preceded major stock market declines—though high readings have been the norm for the past few years without presaging a major drop.

Can Extremes Be Worked Off Without Affecting Price?

From the Bullish point of view, these extremes have been worked off in relatively mild downturns in the seasonally weak periods of February to April and August to October:

Let’s look at a chart of the S&P 500 (SPX), with a focus on the seasonally weak periods:

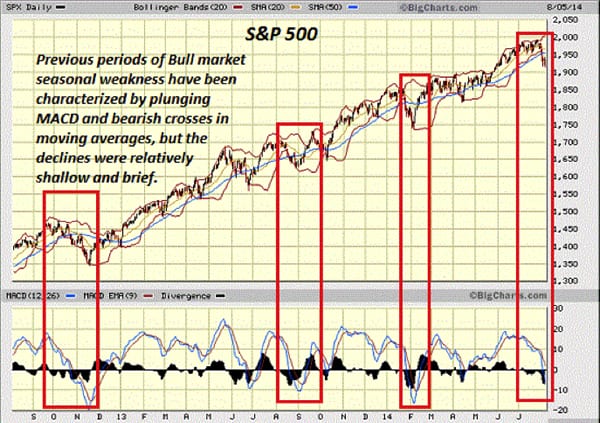
Rather significant declines in indicators such as the MACD have translated into relatively brief, shallow declines.

From the Bull’s perspective, all the extremes in valuations, sentiment, leverage and complacency have been worked off in modest declines that haven’t reached the 10% threshold of a correction. So why should the present period of seasonal weakness be any different?

One potential difference in August 2014 is the sheer number of current financial/market extremes.  Analyst John Hampson prepared a list of all-time records that is impressively long:

Here are some of the all-time records delivered in 2014:

  1. Highest ever Wilshire 5000 market cap to GDP valuation for equities
  2. Highest ever margin debt to GDP ratio and lowest ever net investor credit
  3. Record extreme INVI bullish sentiment for equities
  4. Record extreme bull-bear Rydex equity fund allocation
  5. All-time low in junk bond yields
  6. All-time low in the VXO volatility index (the original VIX)
  7. Highest ever cluster of extreme Skew (tail-risk) readings in July
  8. Highest ever Russell 2000 valuation by trailing p/e
  9. Lowest ever Spanish bond yields
  10. Lowest ever US quarterly GDP print that did not fall within a recession

And this week:

11.  Lowest HSBC China services PMI since records began

12.  Lowest ISE equity put/call ratio since records began

If we had to summarize the current set of extremes in risk appetite, valuations and sentiment, we might state the Bear case as: These extremes characterize the tops of asset bubbles that inevitably deflate in dramatic fashion, despite the majority of participants denying the asset class is in a bubble.

Conversely, we might state the Bull case as: The fundamentals of low interest rates, abundant liquidity, slow but stable growth and rising corporate profits support current measures of value, confidence and risk appetite.

For context, let’s go back in time to the Great Housing Bubble circa 2006-07, when the official and mainstream media narrative denied that housing had reached bubble heights even as the housing market was increasingly dependent on often-fraudulent stated-income (a.k.a. liar loans), interest-only adjustable rate mortgages (ARMs) for sales and mortgage originations.

A report by the U.S. General Accountability Office (GAO) found that almost 80% of all interest-only adjustable-rate mortgages (ARM) and Option ARMs nationwide were stated-income in 2006. In effect, prudent risk management had been thrown out the window. But participants chose to focus on the supposedly solid fundamentals of housing to rationalize their confidence in what was an increasingly obvious Ponzi scheme based on fraud and borrowers who were bound to default once the bubble popped.

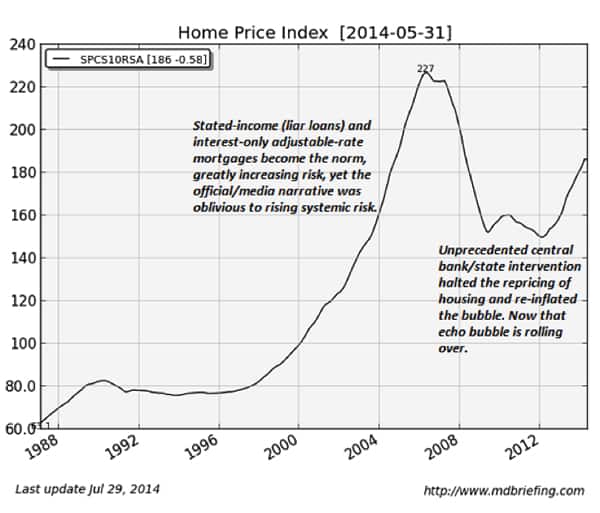
(Chart source: Market Daily Briefing)

In other words, even as valuations, risk appetite, complacency and Bullish sentiment were reaching extremes, participants and Status Quo observers were confident that these bubble valuations were the New Normal.

Those who are confident that the current stock market is fairly valued have to explain why the many current extremes are different this time from previous asset bubbles, and provide an explanation of why extremes can continue indefinitely or be worked off without affecting price more than a few percentage points.

Indeed, what characterizes Bull markets is their ability to work off extremes of complacency (i.e. low volatility) and overbought conditions with only modest declines in price (for example, the S&P 500 is currently down 3.4% from its closing high around 1,988).

But the weight of these numerous extremes is significant, and a detached observer would naturally wonder if such a wide spectrum of extremes can be worked off without affecting price much.

The prudent observer would also ask: Have stocks been pushed to their current valuations by these extremes, or are these extremes merely temporary spikes of exuberance that have little to do with the fundamentals driving valuations higher?

It’s a critical question. For if extremes in risk appetite and sentiment have underpinned the market’s rise, then as these tides recede, price will inevitably follow.

If these extremes are merely temporary spikes that can dissipate without effecting price, then we have to ask: If this is the case, then what are participants afraid of?

We know participants are afraid of something, because the Put/Call Ratio—a measure of participants buying hedges (put options) against a downturn—has skyrocketed to a multi-year high in the past week:

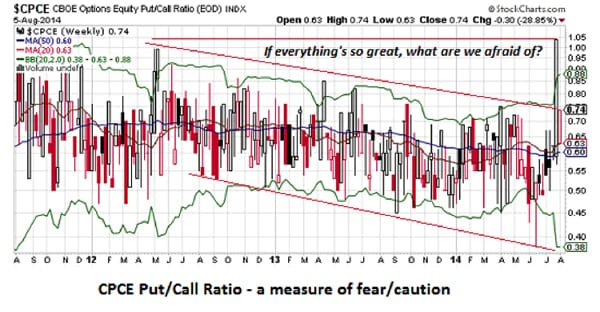
This ratio has traced out a declining channel for the past two years. If nothing fundamental has changed, then what are we afraid of right now?

The Challenge To The Bulls

Those who are confident in the Bull case—that rock-solid fundamentals will drive stocks higher—have a daunting task ahead: they need to explain away the obvious spike in fear/caution, and explain why all these extremes in valuations, sentiment, leverage and complacency have no real bearing on the rock-solid fundamentals.

But given that the psychology of bubbles is characterized by precisely this rationalization of why extremes don’t matter,  Bulls must also explain why their rationalizations don’t mark this as the top of an asset bubble that is remarkably similar in terms of extremes to recent bubbles in housing and stocks.

In Part 2: Prepare For The Bear, we take a look at changing fundamentals that may affect the market’s five-year Bullish bias. We’ll look at how the fundamentals of the Bull case have been weakened or threatened, and determine whether indeed we are witnessing a key moment of direction-reversal in the markets.

Click here to read Part 2 of this report (free executive summary, enrollment required for full access)

This is a companion discussion topic for the original entry at https://peakprosperity.com/is-this-decline-the-real-deal/

I'll be very surprised if we see a market correction of that magnitude on Janet Yellen's watch.

Perhaps what it boils down to is: the Fed omnipotent or not? The narrative for 5+ years has been that the Fed can completely manage the markets more or less at will.  I think it's an open question if indeed the markets are completely controlled by the Fed, or if that narrative is more a construct of PR than reality. The reason for skepticism is the diminishing returns on the techniques the Fed has used to influence markets. If these fail to generate the responses they did 5 years ago, the narrative breaks down.
Topping is a process, not an event, as many say…

Charles,
I think you have the narrative pegged, but we don't know the timing. The Fed is omnipotent for now. Paraphrasing you, at some point more powerful elements in the government will no longer tolerate the inflation and stress on the dollar. So the question is, when is that event triggered? Until then a major correction is unlikely.

I think main street America will cheer when Wallstreet is thrown under the bus, even if it means going from the frying pan to the fire. At least we all suffer together or possibly things get better.

Thank you for mentioning the Deep State conflict between the Fed and the dollar–I think  it is a poorly recognized/understood situation.
As to when–perhaps we get a "taste" of a bear market between now and October, a Santa Claus rally based on "buy the dip" and then a real Bear decline in 2015/16 when inflation and/or threats to the dollar reveal the Fed is not omnipotent and their powers have faded due to diminishing returns.

It's even possible that Fed insiders are tired of trying to prop up a rotten system by themselves, and will throw up their hands in the Bear market, basically saying, we did everything in our power, now you  guys start living within your means… that seems far-fetched but only if you don't recognize the importance of defending the USD.

Leading up to this correction (down about 3.6% so far from the high of 2 weeks ago), I observe the following things:

  • USD clear uptrend - up 3.3% since the lows in May.

  • Energy (oil, gasoline) clear downtrend - oil down 10%, gas down 14% since the highs in June.

  • PM (gold, silver) briefer downtrend - gold down 3%, silver down 7% since mid-July.  And that includes today's big rally.

  • 20-year Treasury uptrend - maybe up 10% since lows of March, flat since May's peak.

  • Junk bond selloff - down 2.2% since the peak in early July.

  • Commodities downtrend - down 10% since highs in late April.

I don't see commodity-price inflation.  I don't see the whole "expanding economy" picture that the +4.0% 2Q GDP print suggests.  I see markets pricing in an economic downturn, going to "risk off", with the equity market noticing the whole thing a bit late.  At the same time, I see money moving into the US, probably a combination of safe-haven combined with an interest rate differential move.

Its a bit tough to say, since some of these are international prices.  But oil dropping so dramatically and consistently with all the crises happening to oil exporters everywhere hints that economic downside risks are trumping geopolitics.  The long bond's rise in the face of the taper lends support - although the shrinking deficit may be a factor too.  The odd man out is copper, which is flat over the period February-August, and up 10% off the "China Default" lows in March.

Perhaps the ECB bank tests are the real deal.  Espiritu Santo suggests they might actually be.

Its a complex messy picture.  Sanctions on Russia (and retaliation on the Eurozone) won't help the current asset bubble to inflate, neither will the eventual international economic costs of containing Ebola, neither will deflation in Europe, neither will the ECB's bank tests and subsequent demands to build up capital.

I'm still waiting for that SPX rally, and I'm also watching the market for signs of how it reacts to news.  Currently, most of the big intraday moves haven't been on economic reports.  They've happened at random times during the day.

My conclusion on this whole thing is "maybe", and I'm waiting for more evidence to show up.  The lack of a rally yesterday was a moderately large-sized deal for me.  It was another change in market behavior.  At minimum, I think we probably get at least another leg down - hopefully after a rally so I can get on board with lower risk.

Its clear the longer term thing is unsustainable.  All the charts show this.  My only issue is, "are we there yet?"   Maybe.  Getting more probable.  But likely not just straight down.

I get the impression that the whole show is driven by feelings.
It seems that the Girls have this thing down pat. It is all about feelings.

How droll.

[quote=Arthur Robey]I get the impression that the whole show is driven by feelings.
It seems that the Girls have this thing down pat. It is all about feelings.
How droll.
[/quote]
https://www.youtube.com/watch?v=jC3JFVKJtyM

I think a big asset downturn is not very unlikely as long as there are large excess reserves at the FED. A ongoing liquidation spiral downwards will soon be stopped by the excess liquidity parked there. It is a big defense mechanism, without needing large (and publicly very visible) market interventions.
Only a flee from the dollar can cause a new crash, but looking at the dependency of Chinese and EU economies on the purchasing power of the US this will for sure not be triggered by one of these 2 economic powers. The majority of the Chinese and EU people have a short future outlook and are very satisfied if their jobs are paying well this year, without ever thinking of the lost purchasing power in the future. The politicians know this.

A correction is possible, but a big downturn doesn't seem likely to me within 5-10 years. Not after all that the dollar was already able to sustain.

Good survey, Dave, thank you. 
I'm not looking for a crash per se but a 15% - 20% decline similar to 2011–not triggered by any particular event but just the weight of risks that would push traders and institutions to move to "risk-off".

The list of these is long, as we all know. If there was anything that could trigger a downturn similar to 2011, it might be junk bonds freezing up.  Fed liquidity may be over-rated as a backstop–why borrow money from the Fed for free to buy a junk bond that could lose 20% of its value overnight? The Fed would have to actually start buying junk bonds to save the market from a much-deserved correction, and I am not sure the Fed wants to save the junk bond market as a policy.

In other words, any risk-off event could trigger a move to the sidelines that would push risk assets lower by 10%-20%.  It could be a rising yen, junk bond freeze-up (i.e. nobody is bidding on the risky garbage that's been offloaded in the risk-on era), a sovereign default, etc.


Hi Taki, and all,
Taki, you shared with us, via the Daily Digest, a Gold Silver Worlds re-post of a Deviant Investor (Gary Christenson) blog post, which itself was basically a repost of Charles' article:

Bubble Mania: Is The Mother Of All Bubbles About To Burst In 2014? (Taki T.)

Consider the analysis from these other writers and then consider your investment risks and your expectations for consequences in our increasingly unstable world.

Ian’s Investment Insights – Special Alert: He makes a good case for the high risk of a major correction in the US stock market, for a turn upward in the HUI (gold stock index), and for a rebound in gold prices.

While Christenson's original Deviant Investor post attributes the article to CHS and PP, the GSW re-post leaves out that attribution, and only contains this unlinked line at the end of the article:

"-end of Charles Hughes Smith article"

It might be better for PP and CHS (and Gary Christenson) if the GSW re-post contained the links to the original article, as well as the title and author at the beginning, as the Deviant Investor post did.

Cheers,

Hugh

P.S. I enjoy looking at the GSW blog from time to time.  The spoiler alert that you included above was not really much of a spoiler, as the outcome described there is common to most articles I have read on blogs like GSW.


One of the things about asset bubbles is that they tend to outlast the bears.  Then, when the last bears finally say "okay, buy", the bubble gets its last umph, and runs out of greater fools.
The bears who held out of the market, and then finally said "buy" being the greatest fools of all.

So let me put this a different way.  You can keep a bubble going, as long as you are willing to do greater damage elsewhere to support the bubble.  As a result, when people say "there's nowhere to go", someone like Janet Yellen, or the Fed, can go to Congress or the President, and say "We have to save the situation".  And the Congress or the Fed or the President will look at their own potential losses, and agree, and make the government the "fool of next resort", to push the stocks higher.

And everyone else looks and says "oh no, they did it again…"  because they see the destruction that is coming their way. 

And the drunks on wall street cheer, and the bars on wall street open their doors, and for another brief time everyone there feels cheerful and loves their neighbor (but only as a matter of feelings, not to be acted on), and says that people are the greatest…

A bailout can be such an act of destruction.  War can be such an act of destruction.  Treason can be such an act of destruction.

Does the market have to correct, or eventually crash?  Yes. 

But timing can be a game for fools.