The U.S. stock market rally has recently passed its fourth anniversary after the terrifying lows of March 9, 2009.
During that time, massive and unconventional reflationary policy from the Federal Reserve has managed to lift the S&P 500 by nearly 70%. But perhaps even more improbably, it has finally (?) built a floor under U.S. residential real estate prices.
This 'Less Bad' Recovery continues in other ways as well.
Jobs have been created. Not good jobs. Not high paying jobs. Not full time jobs. But some rudimentary sets of tasks and responsibilities that could be called jobs.
There has also been deleveraging. But here, too, the scale of debt reduction is nothing close to the unadjusted figures often touted in the media. Americans, and more generally, OECD citizens, remain highly burdened by debt. When combined with poor wage growth, this explains the continued suppressed demand so pervasive in developed nations.
And of course, oil prices – as expressed through prices at the pump – remain stubbornly elevated and are likely to persist at their new elevated level.
Combined, these factors have kept a lid on consumer confidence and make for a precarious disparity between the stock market and the real economy. Welcome to the Great Constraint.
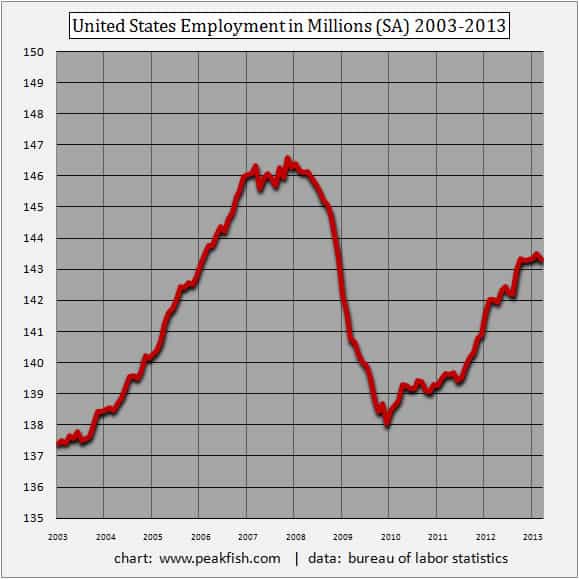
Jobs
Total employment in the U.S. has recovered to about the halfway point of its previous high. Looked at this way, the Less Bad Recovery is chugging along, but at a very slow rate. Total employment, at 143.28 million, sits roughly in the same place as it did in 2005:
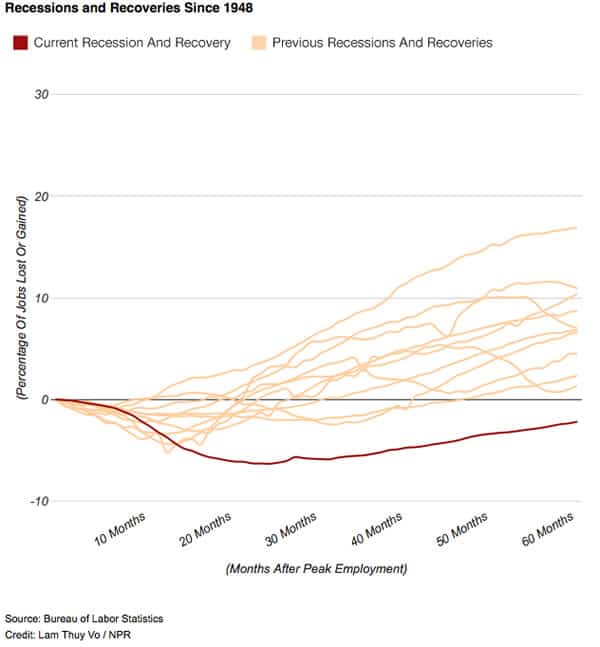
However, a recent chart from Jacob Goldstein at the NPR blog is useful, as it shows how singular and unusual the Great Recession has been during the “recovery” phase compared to other post-war recessions. Goldstein writes:
How much worse is it this time? Here's the answer: In previous postwar recoveries, the number of jobs was about 7 percent above its previous peak by this point, on average. In other words, if this had been a typical recession and recovery, the U.S. economy would now have roughly 10 million more jobs than it did at the previous peak. In fact, there are now three million fewer jobs.
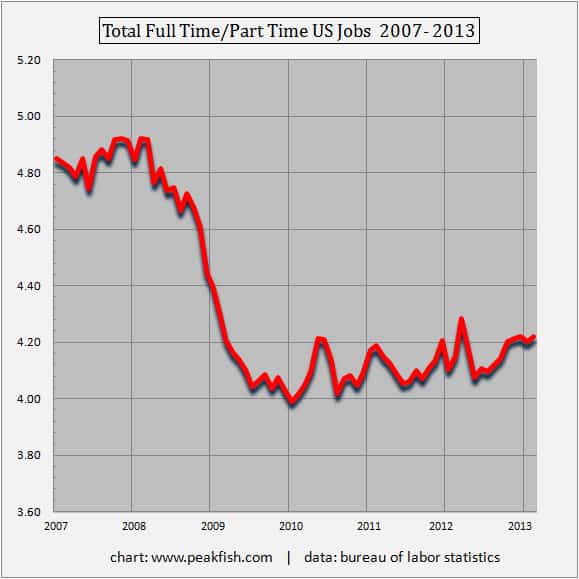
While the pace of the jobs recovery, especially in light of the growing population, remains painfully slow, there is an additional worry that a structural change in which the U.S. economy creates decidedly fewer full-time jobs is now starting to congeal, .
Prior to the crisis, the U.S. economy roughly carried nearly five full-time jobs for every one part-time job. That ratio has now changed. Indeed, each month, with the slight improvement in labor markets, it seems this ratio might actually revert back to prior levels. February's job report, for example, finally showed monthly jobs growth above 200,000. Alas, March's job report was once again very weak, with an addition of only 88,000 jobs. But it's the persistently poor mix of part-time vs. full-time work in the U.S. that's behind poor wage growth and weak purchasing power:
Overall, some analysts maintain that the slow pace of job growth is not nearly as bad as it looks, because the aging retirement class is partly filling the gap by exiting the workforce. This is only partly true. As Pedro da Costa of Reuters points out in a recent column, only half of the declining workforce (which helps to improve the unemployment rate), can be derived from demographic shifts. The rest is all due to the structural hangover from the recession:
The U.S. workforce has been shrinking rapidly in recent years, but a new report from UniCredit highlights just how massive the effect of this trend really is. Economist Harm Bandholz says it amounts to a gaping 3.6 percentage points of U.S. unemployment. That means the U.S. jobless rate, which dropped to 7.7 percent in February, would actually be around 11.3 percent without the decline in labor force participation. This would put American unemployment a lot closer to the euro zone’s recently reported record high rate of 11.9 percent...Of that 3.6 percentage point decline attributable to a shrinking workforce, a little over half is due to long-term demographic factors, Bandholz’s models surmise. But the remainder represents direct damage to the U.S. job market from the Great Recession.
Solving the Problem through Reduced Consumption
Global profits recovered in the past four years and accrued to S&P 500 corporations. Meanwhile, American households greatly reduced their consumption: consumer spending, consumption of oil, travel, and (of course) home and automobile sales were significantly reduced.
Recent data on sector consumption of energy in the U.S. economy shows, for example, massive reductions in the residential and transportation sector – the areas of the economy most leveraged to personal consumption and wage and job growth.
However, in perfect agreement with the recovery in corporate profits, the commercial and industrial sectors have resumed their consumption of energy after the 2008 crisis. Taking advantage of ultra-cheap natural gas, the revival in U.S industry (manufacturing and also computing power) has turned away from liquid fossil fuels and taken advantage of the country's unique ability to produce electricity at very low rates. This partly explains why S&P 500 corporations, who base their executive divisions in the U.S. but who sell their goods abroad, have fared so well.
Adding to the picture is the impact of the Federal Reserve's quantitative easing program (QE) over the past four years. Clearly its benefits did not flow to job growth or wage growth in the U.S. Rather, QE bolstered growth in the parts of the world least burdened by debt – mostly outside of the West, in the Non-OECD.
This raises the uncomfortable question: How much longer can the U.S. stock market continue to rise, given the backdrop of poor domestic growth?
That the S&P 500 has recovered beyond the 1600 level is psychologically encouraging. But it's also a contrary reminder that the main index has sat at these levels not once, not twice, but three times in the last twelve years. That's the kind of record that begins to look like a long, arduous road to nowhere. It sounds like Japan, frankly.
Worse, even at current levels, U.S. stock market indexes have indeed gone "nowhere" over the past decade in real terms. In the past, those who pointed out this disparity between real and nominal prices have received sharp rebukes from the market's cheerleaders. But things may be changing. That hectoring was decidedly hushed when the FED Chairman, Ben Bernanke, made the very same point in his recent March 21, 2013 press conference. From Paul Vigna, at the Wall Street Journal:
Bernanke was asked if the rally in the stock market, a run that's taken the Dow Jones Industrial Average to a string of new highs and has the S&P 500 poised just about six points away from its own record high, is any kind of a sign that the Fed's policies have paid off. Perhaps the questioner was trying to see if Bernanke would provide a “mission accomplished” moment. He's done enough of these pressers by now. He didn't bite. “At this point we don't see anything out of line with historical patterns,” Bernanke said. He further went on to note that while the markets are hitting record highs, those highs are coming in “nominal” terms only. In “real” terms, meaning adjusted for inflation, “we're still some distance from the highs.” It's a point we made ourselves, that once inflation is factored in, the Dow actually hasn't been at a record high since 2000.
Life Quality in Real Terms
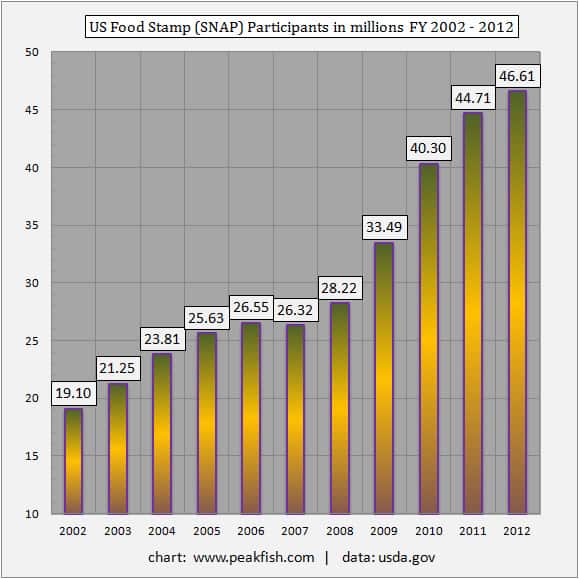
Probably no measure better captures the present mix of prices, wages, energy costs, and growth in the United States than the data on food stamp usage. It was expanding at a rapid rate before 2008 and simply exploded afterwards. The U.S. workforce is currently struggling at the limit of part-time low-wage jobs and has increasingly turned to the SNAP (Supplemental Nutrition Assistance Program) to supplement lean household incomes:
Participation in the Federal SNAP program, which clearly began rising when oil and other commodities began their price revolution, has nearly doubled since 2007. But there's an important point to make here: This trend is not merely about food. Food Stamp purchasing cards simply free up household cash that can be devoted to other non-discretionary items, like utility bills, rent, clothes, and, of course, gasoline.
What we are seeing here is a growing failure to thrive. Nearly 1 in 7 Americans takes some form of Food Stamp assistance. They are the underemployed – the working poor – whose low-wage jobs are completely out of alignment with monthly expenses.
The data for Food Stamp usage is even worse on a regional level. In counties like Los Angeles, more than 1 in 7 people are participating, which is no surprise given that region's exposure to gasoline prices. Indeed, both on a national and regional level, the rate of participation growth slowed occasionally in late 2010 and early 2011, only to start up again. In states like California, where job growth has started to return, we can find a more accurate measurement of the growth in poverty between the lines of "job growth" and food stamp usage .
Unsurprisingly, California residents are broadly negative about their economy and about their future prospects. The most recent Field Poll was absolutely searing in Californians' reported sentiment about jobs and wealth. Over 72% of respondents thought the California economy was enduring bad times:
For a record sixth straight year, more Californians than not say they're worse off than a year ago, according to a new Field Poll released today. California's unemployment rate was in the double digits for years before falling under 10 percent last fall. Still, unemployment remains a "very serious" concern for 61 percent of voters, and a combined 62 percent think the jobs picture will get worse or won't change. "This is the longest stretch of hard times we've ever seen," said Field Poll director Mark DiCamillo. "The severity of this downturn is a record in modern times."
The Great Incongruity
As Jeremy Grantham has pointed out, it's not completely incongruous for the stock market to grow at a slightly higher rate than the economy. This is more easily understood for indexes like the S&P 500, which is really leveraged to global growth and not exclusively limited by the U.S. economy. In addition, reflationary policy continues through ZIRP (zero interest-rate policy) and other tactics of the world's central planners. High commodity prices combined with aging demographics are also acting to keep interest rates low, which continually forces savings away from cash.
But for how long can this continue?
In Part II: Why This Recovery is Coming to an End, we forecast the most probable outcomes for this four-year reflationary rally in stocks, which is beginning to look "long in the tooth." True, stock market bears have been wrong for quite some time now, as they perpetually doubted the ability of OECD central banks to fight deflation. But at this point, sluggish job growth in the West and moderating economic growth in Non-OECD countries makes current stock price levels look risky. How far stretched from fundamentals can S&P 500 stocks become before risk-reward prospect turn decidedly negative?
Click here to read Part II of this report (free executive summary; enrollment required for full access).
This is a companion discussion topic for the original entry at https://peakprosperity.com/marking-the-4-year-reflationary-rally-how-much-better-off-are-we-really/