Red Screen At Morning, Investor Take Warning

Growing up as I did in coastal New England, this old rhyme was drilled into us as children:

Red sky at night, sailor's delight;

Red sky at morning, sailor take warning.

Because many of the people in town still made their living on the sea, the safety of person and property depended on being able to recognize the signs of approaching danger.

A notably red sky at morning is usually due to sunrise reflection off of moisture-bearing clouds, signifying an arriving a storm system bringing rain, wind and rough seas. Those who ignored a red sky warning often did so at their peril.

Red Sky In The Markets

I'm reminded of that childhood rhyme because the markets are giving us a clear "red sky" warning right now. One that comes after (too) many years of uninterrupted fair winds and smooth sailing.

The markets have plunged nearly 8% over just a single week. And the losses are across the board. Nearly every asset class from stocks to bonds to commodities to real estate are participating in the pain. Market displays are a sea of red.

We've written so often and recently of the dangerous level of over-valuation in asset prices (caused by years of central bank intervention) that to re-hash the premise again feels unnecessary.

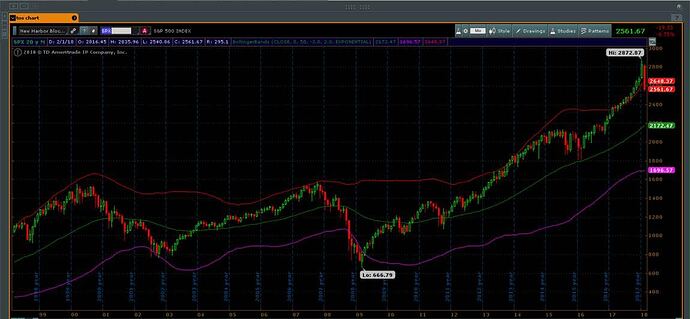
But the chart below is worth our attention now, as it really drives home just how dangerously over-extended the markets have become. It's a 20-year chart of the S&P 500, showing how it has traded vs its 50-month moving average (the thin green line).

Importantly, the chart also plots the Bollinger bands for this moving average. These are the thin red (upper) and purple (lower) lines above and below the green one.

The simple definition of Bollinger bands is that they are measurements of volatility, and serve as indicators of "highness" or "lowness" of price relative to trading history (a more complex explanation can be found here).

What that means is, when the price of the S&P 500 trades near the upper (red) Bollinger band, that's an indication it's over-priced vs its historic trading behavior. And vice-versa when it trades near the lower (purple) band.

Now, the chart below is important because it shows that over the past 20-years, the S&P 500 has *never* traded above the its 50-month upper Bollinger band -- EXCEPT for the 7 months preceding this one. Simply put, the market had not been more overvalued in (at least) the past 20 years as it was last month:

(click here for an expanded view)

But just as frightening, though, is how the 7% drop the S&P has experienced over the past week has only brought it back to just touch the upper Bollinger band. Despite its recent losses, the S&P is still wildly over-valued.

Said another way: it still has further to fall. A LOT further.

If indeed this is the start of a major correction, one that clears out all  "excessive exuberance" as happened in 2001 and 2008, we could well see a retracement down past the 50-month moving average, all the way to (and possibly, briefly, below) the lower Bollinger band.

That would put the S&P somewhere around 1,500-1,600 -- a drop of around 40% from where it closed today.

And as we made the case earlier this week when looking at classic asset price bubble curves, a return of the S&P to a price level below 1,000 can't be ruled out.

Time To Batten Down The Hatches

When a storm arrives at sea, sailors hunker down. They strip, tie fast, and stow everything they can -- then they ride out the storm and re-emerge once it has passed.

This is an excellent model for today's investor. If this week's plunge indeed accelerates into a bear market, simply surviving the carnage with a substantial percentage of your capital intact will constitute "winning".

So, if you still have long positions in your personal or retirement portfolios, what should you be doing at this point?

1) Move To Cash

Get your money to the sidelines. Remember that everything is relative during periods of extreme volatility like now. When everything around you is dropping in value, the relative value of your cash position rises.

Those who had already moved to cash now find they can buy 7% more of the S&P with it than they could a mere week ago. That relative rise in purchasing power will only increase should the markets fall farther from here.

Cash is also offering an improving absolute return as well these days, as interest rates rise. Not that you'd know it from what your bank is offering you (surprising no one, banks have kept depositor rates near 0% despite receiving higher interest payments themselves from the Federal Reserve).

But holding your cash in short-term T-Bills (durations of less than 1 year) through a program like TreasuryDirect is now returning yields of close to 1.5%. That's 25-50 times(!) more than what the average bank savings account interest rate is right now.

Given this high relative payout and the extreme safety of Treasurys (the last financial instrument in the world likely to default, as the US will simply print the money to repay, if necessary), this strategy is a clear no-brainer for those with a material amount of cash.

Those looking to learn more about the TreasuryDirect program, including how to open an account there, can read this primer we created.

2) Prepare Your Action Plan

We have long been loud advocates of working with a professional financial advisor. Now, more than ever, you want to review your action plan with him/her.

If you have remaining long positions, battle test them. How do you expect them to perform in a bear market? If the market falls another 10% from here, what will be the expected impact to your overall portfolio? What if the market falls 25%?

Does hedging make sense as a risk management strategy for you? How about building up a short position with a minority percentage of your portfolio?

Now is the time to address and answer these questions, because if indeed a major correction is nigh, it very well may happen so fast you don't have time to act. (Just ask those holding Bitcoin in January how quickly 50% of your position can vaporize.)

As always, if you're having difficulty finding a firm willing or able to engage in the above with you, consider scheduling a free consultation with Peak Prosperity's endorsed financial advisor.

Also, folks frequently underestimate the effort and time it takes to set up accounts, get funds transferred, etc. Don't set yourself up for the frustration and disappointment of delays should you wait until the midst of a market melt-down to get all this in place. The market may be moving so fast at that point as to make your efforts moot. (Again, talk to the crypto crowd here about their challenges funding accounts and trading through the exchanges last month.) 

Instead, get everything set up and prepared now. You don't need to necessarily transfer any funds at this point. But do yourself the service of getting all the administrative hurdles behind you today.

3) Track The Risks & Opportunities Closely

As we've warned for years, we've been living through The Mother Of All Financial Bubbles. When it bursts, the damage is going to be truly horrific.

The ride down in the markets is going to be painful and scary. There are going to be many knock-on effects that are impossible to forecast with precision -- or even to identify -- right now. What will happen with housing, jobs, pensions, entitlement programs, social services, the banking system? All could be impacted.

To what degree? We don't know at this point. Which is why tracking developments in real-time and assessing their likely impacts will be critical.

Similarly, in crisis there is opportunity. There will be speculative opportunities that present themselves during a melt-down (e.g., shorting mortgage insurers during the 2008 crash). And once markets find their bottom and stabilize, there will be the chance to invest in quality assets at fire-sale values compared to today's prices.

Knowing when to deploy your dry powder, and what to deploy it into, will be key.

We'll be doing our best here at PeakProsperity.com every week to offer essential insights to help you stay well-informed and on top of these fast-moving events.

To that mission, we've swiftly assembled a webinar on this coming Tuesday, February 13, 2018 at 8pm EST with Chris Martenson, Axel Merk and several other financial experts to provide in-depth context into the recent market plunge, as well as their best assessment of what to expect from here in the near term. (To learn more about the webinar, click here)

Markets are warning us that even stormier seas lie ahead. Heed that warning, sailor, and hold fast!


This is a companion discussion topic for the original entry at https://peakprosperity.com/red-screen-at-morning-investor-take-warning/
Good and timely article, Adam. I’ve been frustrated with the interest that my bank provides. I’ve been thinking of opening a Treasury Direct account but just haven’t done it yet. That will change next week. The interest rate differential is quite large, but a bigger concern for me is the safety. My deposit in the bank is a short term loan to the bank and essentially unsecured. If the bank goes bankrupt, I’ll be in the group at the end of a long line of creditors. As much as I hate funding the government, it appears to be a safer as well as a more lucrative option.
The federal reserve has signaled that they intend to raise interest rates further. They’ve also embarked on plans of quantitative tightening. At the same time, we’ve got federal deficits baked into the cake for a long time. The recent budget compromise fiasco will spend more than was originally planned to fund the tax cuts. That money has to come from somewhere. Competition for funds should get noticeably stronger going forward.
The mortgage interest rates are starting to creep up as well. These are based off US 10 year yields. MarketWatch.com shows the 30 year fixed rate at 4.31% (because the US 10 year yield is now 2.85%.) Although still low by historical standards, it is about 1% higher than the recent lows. If it goes up much higher, it will start affecting home buyers, which will force sellers to take a reduced price. That might prick the current housing bubble. That has many knock-on effects throughout the economy. Will that cause or exacerbate a recession? Can the banks withstand a shock to their bottom lines? How long can they? I expect the answers will come with time.
Grover

Do you think today’s rebound was:

  1. Central bank intervention
  2. Dip buying
  3. Both
  4. Something else
    I was talking with someone in the airport today, her first question to me was “are you going to buy the dip?” I plainly stated “I don’t think this is a dip”, strange look ensued.

For years I’ve been lamenting the poor performance of gold, well finally that is “somewhat” paying off as it rides out the storm for us. Here’s hoping this is the beginning of the end of the gold suppression scheme!! (or maybe we shouldn’t, seeing what’s on the other side).

Thank you Adam and Chris for working hard and keeping us updated. The markets and finance are not in my wheelhouse and it’s great to have information even I can digest.
thank you,
jeff

Jeff, many of us are asking the same question. I suspect it’s #3, some buying by central banks (that is, a bump higher in the buying they’re already doing as policy) and “buy the dip,” which is now a deeply engrained behavior that will take repeated losses to modify.
If we look at indicator such as NYMO (McClellan Oscillator), CPC (put-call ratio), etc., these sank to extremes, suggesting a relief rally is on tap, Technically, declines tend to stairstep down: a big drop, then a relief rally that rolls over into another decline,and so on. Given the rewards that have been showered on those who bought every dip for 9 years, that behavior will cause dips to be bought for quite some time.
We can also expect TPTB to push markets to new nominal highs, just to scorch Bears and “prove” (since the stock market is now a signaling device) that everything is back on track.
Lastly, it’s options expiration next Friday, and market-makers hate to hand Bears big profits for being short/holding puts. Typically, markets rally into Wed. of OEX week and it usually doesn’t pay to bet against that.

I forget right now who it is that always says it, but if things don’t play out that way and next week is carnage in the markets again, it’s probably fair to say you’ll need to do more then settle your mare- you’ll need to bring the whole herd into the barn and lock up for a while…

Speaking psychologically, the question is whether non-institutional buyers see this Friday’s bump up as a sign they should BTFD, or whether it’s an opportunity to sell at a higher price than they could have on Thursday.

At least it wasn’t a boring week, eh?

Thanks for that information Charles. Trying to educate myself, this is very helpful.
Jeff

No matter what the stock market does, many companies are 1) making LOTS of money (ROIC), 2) sharing this money with their investors (dividend PO), & 3) too big to fail (in modern bailout culture).
I find the whole bear market-hate bemusing. Sheese, haven’t we lived through a bear market or to since 1929? We haven’t even started this bear market yet and everyone is crying foul. Lots of money to be made here if we can get a real collapse going like 2008 and the government stops bailing everyone out for just a year or two. One just watches the market dividend yield never holding more than 50% of one’s NW in stocks when the yield falls below 2.2% (and of course buy only undervalued blue-chip stocks to protect capital (bailout culture wont’ let those stocks fail).
The modern popularity of the mutual fund has made many believe the “market of individual stocks” & the “stock market” are the same thing. They aren’t. You don’t have to date every girl, nor buy every stock. There are overvalued and undervalued stocks (based upon what they cost vs pay in dividends). Just because there are more losers than winners at any given time doesn’t mean much to me except a buying opportunity if the right, safe, money-making stock gets cheap enough.
Dividends (which is just money earned from the hard, enterprising work of real people slaving 9-5) generates real wealth in the form goods and services which we all use. Owning dividend paying stock allow me to spend this real wealth on my personal consumption then plow back the extra into more stocks, real estate, and 10% gold. So who cares what the “stock market” is doing? I Just care about the dividends.
The future decades of the stock market will be interesting as I’m not sure government bonds will pay much more than inflation plus I doubt the government will let blue-chip stocks fall much via bailouts (see 2008). Remember, the FED has been screwing with the market since 1929 and a lot of real technological wealth has been created since that time. I’ve certainly benefited playing this game. Besides, government inflation demands we play somehow. Risky? Sure. Just own a house with a hand pump well & garden and hold no debt. The rest is gravy. Risk on!

FWIW: I am hestient to put much faith into maket graphs and functions to determine future performance. Corrections are initialated by economic news (or the lack of it). I suspect that this correction was initiated by a combination of CB QE pull backs & the lack of good news to drive investor confidence. I also believe that most of investor capital has been nearly fully invested and there wasn’t much more capital sitting on the sidelines needed to push markets higher. Some large investors likely decided to take some profits resulting and no buyers available to sell to.

  1. CB’s withdrawl of liquidity (ECB tapering QE, & US Fed selling assets purchased during 2009-2012).
  2. US tax cuts fully priced into the economy by the end of January, which caused the"blow off" period when investor enthusiasm probably peaked for 2018.
  3. Consumers and Business borrowing likey peaked, as consumers & business are unable to expand debt without running into issues servicing their debt. From ~2009 to current. Most business and consumers used lower interest to increase debt instead of reducing debt (making use of savings from lower rates to paydown debt). Now we may be approcating a simular situation as consumers & business did in 2007-2008 when they ran into issues servicing their debt. The issue is that in 2008-2009 the CB banks had room to lower rates (ie going from ~8% loans to 3-4% loans). Cutting interest rates again is likely not going to work again.
  4. Demographics continue to drag money velocity. Boomers probably are entering their peak savings rate as older boomers retire, swtich to a lower fixed income, and younger boomers are saving more for retirement as they grow closer to retirement age. The younger generations (Gen-X is a much smaller generation), and the Millennials do not earn as much as boomer generation (Lack of career enthusiasm, poor career choices, excessive studentauto loan debt).
  5. Companies are still in cost cutting more as there is little real growth. Business are cutting cost by outsourcing, automating, and consolidating. These are not helpful to employment and wage growth.

Considering demographics, and debt, we are probably on borrowed time before the next recession & crisis begins.
FYI: Some articles of interest
http://www.businessinsider.com/consumer-debt-surges-and-subprime-auto-de…
Mortgage debt surged 4.2% year-over-year, to $9.19 trillion, still shy of the all-time record of $10 trillion in 2008 before it all collapsed.
Student loans surged by 6.25% year-over-year to a record of $1.36 trillion.
Credit card debt surged 8% to $810 billion.
“Other” surged 5.4% to $390 billion.
And auto loans surged 6.1% to a record $1.21 trillion.
https://www.fool.com/investing/2018/01/21/margin-debt-at-record-levels-k…
Like the stock market, margin debt has risen sharply in recent months. According to FINRA’s latest margin statistics, borrowing by investors in November 2017 stood at an all-time high of $627.4 billion. This is almost a $100 billion increase over margin borrowing at the end of 2016 – and more than double the level of borrowing at the end of 2010.

ALL,

Thanks for the comments, Adam.

Sailor take warning: in this “market”…warning, to me, is NOT to be taken “in” the market.
Talk about variances and over valuations.
The market, per se, is a total casino. If you can “trade” faster than an algo/HFT…good for you. There is fragility EVERYWHERE.
This time is it obviously, NOT different.
As China prepares for the petro-yuan, as the events in Syria attempt to distract the sheeple, as the noise in DC reveals some of the absolute disconnect within “all” of the beltway…there are NO markets.
There exists illusions: PPT is a prime example. It is all about MOPE: mgt of perceptive economics. Optics.
For those with the temerity to be “in the market”…more power to you.
Long ago I’ve committed to be in a physical position. The premiums are near all time lows. The amount of physicals are near all time lows. The pump/dump of the markets is enuf to distract even a seasoned participant.
Cash IS a position. And given the irritability of the valuations we are seeing…you can NOT catch a falling knife.
Best is to remember the Scouts motto: “be prepared”.
To all on this board: I wish to each and every one of us all that we are willing to commit to…in an effort to sustain our individuality and collective community.
Action is required. If you have NOT taken action…please take heed: there is obvious blood in the water. Smell the coffee !
These next few weeks…through the end of March…will be historic. An ounce of preparation will be worth a lifetime of intentions…
Seize the day. We are living in extraordinary times.

Best,

Tom

tomadkins wrote:
Long ago I've committed to be in a physical position. The premiums are near all time lows. The amount of physicals are near all time lows.
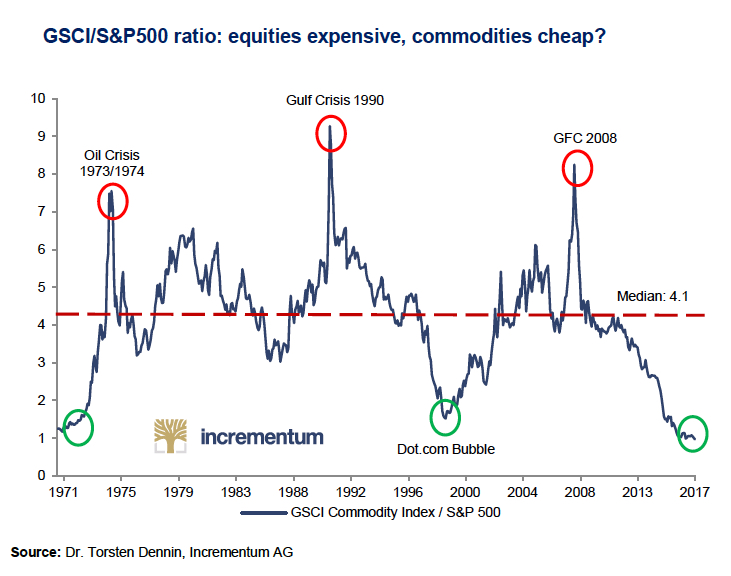
Tom - You'll see this chart again in future articles on PP.com: GSCI/S&P 500 ratio chart Commodities are at their lowest relative valuation compared to stocks than at any other time in the past half-century. For many reasons, that imbalance can't last. And it will likely be correct by both equities falling AND commodity prices rising. I do worry that, in the near term, a market melt-down may send commodity prices lower, too, as everything not nailed down gets sold to meet margin calls, etc. But when they come into their own, I expect the upward re-pricing to be sudden and sharp (meaning: you'll very likely need to have had built your position in advance to participate in it)

Here’s a long term valuation chart - total market cap of all US equities divided by GDP. It suggests that, from a valuation standpoint, we haven’t exceeded 2000 quite yet. That’s because GDP has doubled from 2000 to today.
But you probably can’t call this market cheap either.

As Gail the Actuary and other wise people have pointed out, there’s commodities, then there’s the _____ you can’t live without. And it used to be _______ a lot of us knew how to make, or manage, or grow.
I have such a hard time analyzing this stuff anymore because were at such a unique breaking point in our physical world. With that, I suppose, “the markets” have never been such a sick and meaningless shadow play. As Gail reminds us, sure the stuff is cheap and getting scarce but no one can pay for it…because the stuff is actually NOT cheap and getting scarce. But that doesn’t mean a broken planet can pay the price. Well…not a price the way we think of it. The real world of real things is broke, really broke…in every meaning of the word. If mis-pricing was our only problem, I suppose rocket stoves and permaculture would be just another fad.
Sometimes I wonder if its the very nature of the abyss that makes us all wannabe actors in this silly and maybe suicidal thing called modern markets. So the commodities may be ripe for the picking, but there’s only so much you can pick.
As Nate Hagens pointed out years ago on this site, a stock market can be fun and profitable but we actually may not have a stock market soon. Because it runs in my family, I’m probably being over dramatic… but I keep feeling that I should learn how to make, store and ration my commodities before I learn to buy them.

if we set 2000 aside as an anomaly then we’re looking at the peaks in 1966 and 2007 for comparables, and by those standards, we’re clearly in bubble territory.

Let’s not forget just how crazy the DCB was- e.g. Pets.com vaporized $300MM, but IPO to bust in less that a year was some serious snake oil peddling.

GDP is totally contrived. A strong argument can be made it’s much lower than what the Fed or other government folks tell us. Fake news if you ask me.

What would you like in the denominator, if not GDP?
You may not know that GDP is nominal GDP, as opposed to real GDP (GDPC1) which is deflated by those inflation metrics that we all don’t like.
Would you prefer LOANINV? TCMDO? Total Wages & Salaries of all non-government workers? It has to be something in nominal dollars so it matches MVEONWMVBSNNCB.
You pick a denominator that, for you, isn’t ‘fake news’ and I’ll be happy to post it.

mare trained to the lines and a few critters will be worth more than the markets…someday.