[Many longtime followers of the Crash Course have asked Chris to update his forecasts for Peak Oil in light of the production increases in shale oil and gas over recent years. What started out as a modest effort at clarification morphed into a much more massive 3-report treatise as Chris sifted through mountains of new data that ultimately left him more convinced than ever we are facing a global net energy crisis – despite misguided media efforts intended to convince us otherwise. His reports are being released in series over the next several weeks; the first installment is below.]
There has been a very strong and concerted public-relations effort to spin the recent shale energy plays of the U.S. as complete game-changers for the world energy outlook. These efforts do not square up well with the data and are creating a vast misperception about the current risks and future opportunities among the general populace and energy organizations alike. The world remains quite hopelessly addicted to petroleum, and the future will be shaped by scarcity – not abundance, as some have claimed.
This series of reports will assemble the relevant data into a simple and easy-to-understand story that has the appropriate context to provide a meaningful place to begin a conversation and make decisions.
Since completing the Crash Course in October of 2008, much has gone as I anticipated in the way of money printing, official neglect of the main predicaments we face, and generally higher petroleum costs (2012 was the record so far on a yearly basis).
What has not changed is the general trajectory of liquid fuels becoming increasingly expensive and more difficult to produce. I know that this runs counter to virtually every news article that has come out recently. It is time to separate the data and facts from the hype. Much has recently been either muddied or presented so far out of context as to be more distortive than helpful.
This entire body of analysis is so large that it will be broken into three pieces.
The first is a general world outlook for petroleum that presents the macro picture, provides some necessary clarifications on definitions, and illustrates that all of the data is consistent with the idea that the world is on a plateau of oil production. Here we note that exactly zero of the major energy outlooks provided by the IEA, the EIA, BP, and especially the inexcusably sloppy piece put out under the auspices of Harvard (the Maugheri report of 2012) all failed to make any mention of the declining net energy provided by any of the new unconventional oil finds. This is a crucial oversight.
The second report will focus on natural gas in the U.S., with a particular emphasis on shale gas, the supposed game-changer that we have read so much about. There are some very important elements to this story, but the punch line is that there's nowhere near "100 years" of this magic fuel, it costs more to produce than it is being sold for at present here in early 2013, and – once we include the idea of future increases in consumption – there may only be in the vicinity of 20-30 years of proven and probable reserves. And that is if and only if prices rise by a factor of 2.5x or more from the current $3.30 per therm market price.
The third will focus on tight oil, often called shale oil (not to be confused with oil shale, a very common mistake), and make the case that, while it may have some modifying effect to the Peak Oil story, it lacks the ability to return the world to anywhere near its prior glory years of ~2% per year growth in global oil output.
The summary of all three reports leads to the conclusion that all efforts to cram the world full of fresh rounds of new debt lending are going to end in failure because the requisite net energy is simply not there to support continued debt accumulations running several-fold faster than actual economic productive output.
Enormous risks are continuing to build in the world's financial landscape, and the continued unwillingness to confront the truth about our global energy predicament is both puzzling and frightening. The conclusion is that our future resilience as individuals, corporations, or countries will hinge to a very large degree on whether or not we heed the warning signs and adapt our lives and habits to the actual circumstances.
The Really, Really Big Picture
The really big picture goes like this: Humans discovered about 400 million years worth of stored sunlight in the form of coal, oil, and natural gas, and have developed technologies that will essentially see all of that treasure burned up in just 300 to 400 years.
On the faulty assumption that fossil fuels will always be a resource we could draw upon, we fashioned economic, monetary, and other assorted belief systems based on permanent abundance, plus a species population on track to number around 9 billion souls by 2050.
There are two numbers to keep firmly in mind. The first is 22, and the other is 10. In the past 22 years, half of all of the oil ever burned has been burned. Such is the nature of exponentially increasing demand. And the oil burned in the last 22 years was the easy and cheap stuff discovered 30 to 40 years ago. Which brings us to the number 10.
In every calorie of food that comes to your table are hidden 10 calories of fossil fuels, making modern agriculture and food delivery the first type in history that consumes more energy than it delivers. Someday fossil fuels will be all gone. That day may be far off in the future, but preparing for that day could (and one could argue should) easily require every bit of time we have.
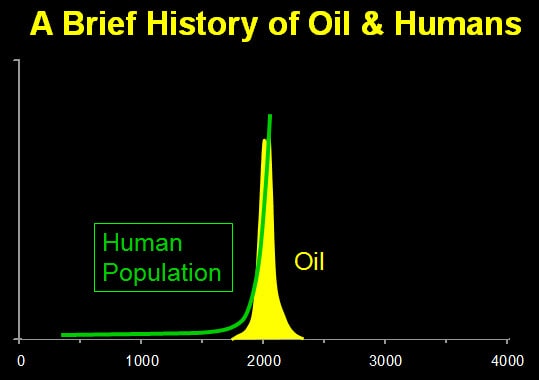
What galls me at this stage is that all of the pronouncements of additional oil being squeezed, fractured, and otherwise expensively coaxed out of the ground are being delivered with the message that there's so much available, there's nothing to worry about (at least, not yet.) The message seems to be that we can just leave those challenges for future people, who we expect to be at least as clever as us, so they'll surely manage just fine.
Instead, the chart above illustrates that on a reasonably significant timeline, the age of fossil fuels will be intense and historically quite short. The real question is not Will it run out? but Where would we like to be, and what should the future look like when it finally runs out? The former question suggests that "maintain the status quo" is the correct response, while the latter question suggests that we had better be investing this once-in-a-species bequeathment very judiciously and wisely.
Energy is vital to our economy and our easy, modern lives. Without energy, there would be no economy. The more expensive our energy is, the more of our economy is dedicated to getting energy instead of other pursuits and activities. Among the various forms of energy, petroleum is the king of transportation fuels and is indispensible to our global economy and way of life.
To what do we owe the recent explosion in technology and living standards? To me the answer is simple: energy.
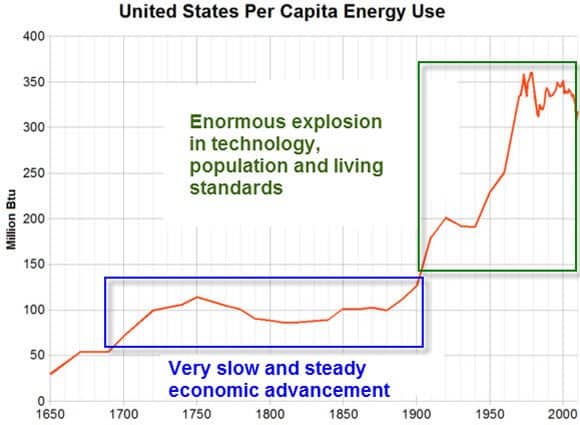
(Source)
Because a very large proportion of our society was no longer tied up with the time-consuming tasks of growing their own food or building and heating their own shelter, they were free to do other very clever things, like devote their lives to advancing technology.
When energy starts to get out of reach either economically or geologically, then people revert to more basic things, like trying to stay warm – such as this fellow:
Greeks Raid Forests in Search of Wood to Heat Homes
Jan 11, 2013
EGALEO, Greece—While patrolling on a recent cold night, environmentalist Grigoris Gourdomichalis caught a young man illegally chopping down a tree on public land in the mountains above Athens.
When confronted, the man broke down in tears, saying he was unemployed and needed the wood to warm the home he shares with his wife and four small children, because he could no longer afford heating oil.
"It was a tough choice, but I decided just to let him go" with the wood, said Mr. Gourdomichalis, head of the locally financed Environmental Association of Municipalities of Athens, which works to protect forests around Egaleo, a western suburb of the capital.
Tens of thousands of trees have disappeared from parks and woodlands this winter across Greece, authorities said, in a worsening problem that has had tragic consequences as the crisis-hit country's impoverished residents, too broke to pay for electricity or fuel, turn to fireplaces and wood stoves for heat.
I think it is safe to assume that all of the people in Greece who are chopping down trees to stay warm are not simultaneously working on the next generation of technology. Energy first; everything else second. In other words, our perceived wealth and well-being are both derivatives of energy.
Like every other organism bestowed with abundant food – in this case, fossil fuels that we have converted into food, mobility, shelter, warmth, and a vast array of consumer goods – we first embarked on a remarkable path of exponential population growth. Along with these assorted freedoms from securing the basics of living, we also fashioned monetary and economic systems that are fully dependent on perpetual exponential growth for their vitality and well-being. These, too, owe their very sustenance to energy.
It bears repeating: Not just energy is important here, but net energy. It's the energy left over after we find and produce energy that is available for society to do all of its complicated and clever things.
Not only is the world struggling right now to increase global oil production, but all of the new and unconventional finds offer us dramatically less net energy to use as we wish.
Where We Are, in Three Simple Charts
One narrative that is being heavily marketed right now is that the shale plays are true game-changers and there's really nothing to worry about for the foreseeable future. Heck, the story says that the U.S. will soon exceed Saudi Arabia in oil production and become energy independent, that it has so much natural gas that it might as well build export terminals, and that there's 100 years of natural gas just waiting to be used.
Unfortunately, none of this is really true. Here's how I can make the case for that assertion using just three charts.
This first chart comes to us from the EIA courtesy of one Mr. Sweetnam, a former director at the EIA who was promptly reassigned to a distant position when his superiors discovered that this chart revealing declines in existing conventional oil fields had been released to the public.
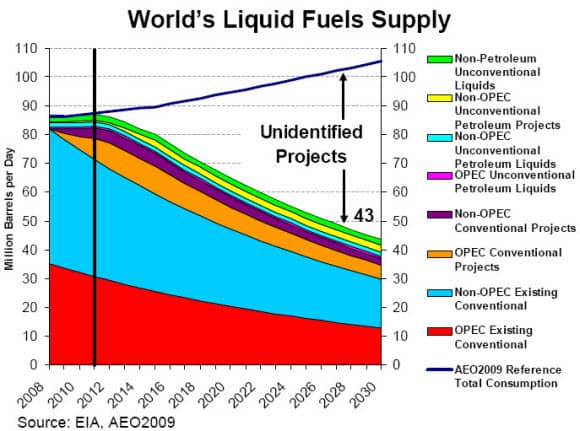
What this graph shows is the projected decline of all known projects in 2009 (so this does not have the U.S. shale 'revolution' baked into it, but I'll get to that shortly), and it shows that those projects are going to slip from delivering 85 million barrels per day (bpd) of crude oil to just 45 million bpd between 2012 and 2030. In other words, 40 million bpd will go missing. But it's worse than that, because demand is expected to grow, leaving a gap of more than 60 million bpd by 2030.
If that sounds like a lot, it is, but that's just an assumed rate of production decline of 4.08% per year, which is right in the midzone of expert estimates. Some estimate decline rates as high as 6.5%, which would really amplify the drop and the resulting gap.
The top line is showing how much oil demand would grow if it was going to expand at the usual historical rates. The gap between those two modeled states is 60 million barrels [Edit: this orignially read "43 million barrels" but has been corrected]. To put that in a U.S. shale context, the EIA projects that the domestic shale plays might deliver as much as 3 million barrels per day by 2020, which is nothing to sneeze at, but even with that there's a projected 60 million bpd shortfall Edit: this orignially read "40 million barrels" but has been corrected].
The second chart I want you to look at is this one which shows total world crude oil production over the past 12 years:
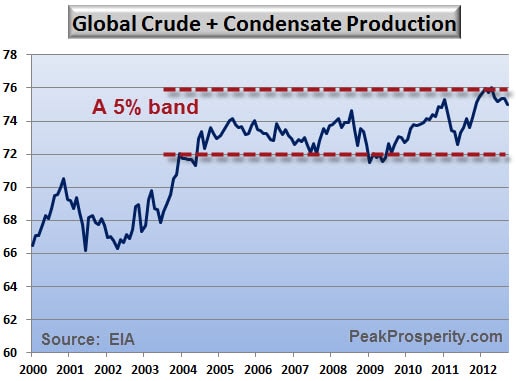
Between 2004 and 2012, the total supply of global crude oil + condensates (a definition which excludes the non-transportation fuels known as natural gas plant liquids and biofuels) has just flopped around in a tight band with only 5% wiggle.
It bears noting here that the 2004 average spot price for crude oil (using the Brent contract, as that better defines the 'world oil' price) was $38.35/bbl, while the average 2012 spot price was $111.63, or 2.9 times higher than the 2004 price.
Despite this near tripling in price, the global supply is just sitting there stuck on a plateau. Economically speaking, this is not supposed to happen. What is supposed to happen is that suppliers will react to these higher prices and deliver more to the market, and then prices will settle down. But that hasn't happened, which indicates that global oil supplies are, as expected, constrained by something other than market forces.
This brings us to the third chart of global spending on oil projects:
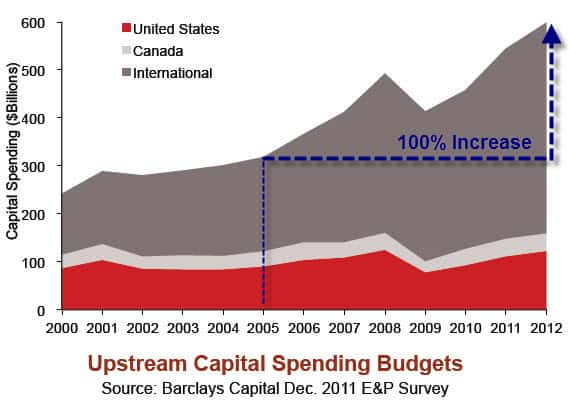
What also happened during the time that global supplies of crude oil were undulating along that 5% plateau? Global expenditures on oil projects jumped by 100% from $300 billion per year to $600 billion. With a 100% increase in capital spending by the petroleum industry, we saw petroleum supplies remain more or less stuck in the exact same spot.
I am of the impression that $600 billion a year is a lot of money and that the people dedicating that capital are applying it to the very best projects available. I make the further assumption that when a project is identified and pursued, it is brought on line as rapidly as possible. There are not that many ways to look at this data other than noting that we are spending more and more to get the same...for now.
If you want to know why oil costs over $110 on the world stage, the last two charts above give you the answer: There's just not that much of it to go around.
Despite all of this effort and expense, the world is basically treading water with respect to overall production. The reason for that is contained in the first chart out of these three: The race is now on to bring new projects on line quickly enough to offset the losses from existing fields.
Petroleum is neither a U.S. issue nor any other specific country's issue, but rather a global commodity of immense importance. While the development of the shale plays in the U.S. is of domestic importance, it has not altered the global dynamic of static oil production – at least not detectably in the global supply charts. Not yet.
Conclusion (to Part I)
In Part II: How Energy Woes Will Trigger Financial Crisis, we look at the latest global petroleum supply and demand data and see clearly that cheap oil has become extinct. That era is over for humankind.
My prediction is that the underlying rates of depletion will continue to fight the recent production gains in the U.S. and elsewhere in the world until they soon come to a standstill, eventually swamping even heroic efforts.
Steadily rising energy costs and decreasing net energy yields will simply not be able to fund the future economic growth and consumptive lifestyles that developed nations are depending on (and that developing nations are aspiring to). In fact, the persistent global economic weakness we've been experiencing over the past years is an expected symptom of the throttling constraint decreasing net energy places on growth.
If you care about the future of the economy, your standard of living (or that of your children), and/or your quality of life, you need to fully understand this relationship between growth and net energy. Your individual future (and our collective one) depends on it.
Click here to read Part II of this report (free executive summary; enrollment required for full access).
This is a companion discussion topic for the original entry at https://peakprosperity.com/the-really-really-big-picture/