Now that oil’s price revolution – a process that took ten years to complete – is self-evident, it is possible once again to start anew and ask: When will the next re-pricing phase begin?
Most of the structural changes that carried oil from the old equilibrium price of $25 to the new equilibrium price of $100 (average of Brent and WTIC) unfolded in the 2002-2008 period. During that time, both the difficult realities of geology and a paradigm shift in awareness worked their way into the market, as a new tranche of oil resources, entirely different in cost and structure than the old oil resources, came online. The mismatch between the old price and the emergent price was resolved incrementally at first, and finally by a super-spike in 2008.
However, once the dust settled on the ensuing global recession and financial crisis, oil then found its way to its new range between $90 and $110. Here, supply from a new set of resources and the continuance of less-elastic demand from the developing world have created moderate price stability. Prices above $90 are enough to bring on new supply, thus keeping production levels slightly flat. And yet those same prices roughly balance the continued decline of oil consumption in the OECD, which offsets the continued advance of consumption in the non-OECD.
If oil prices can’t fall that much because of the cost of marginal supply and overall flat global production, and if oil prices can’t rise that much because of restrained Western economies, what set of factors will take the oil price outside of its current envelope?
Those who still don’t understand the past ten years cling to the antiquated view that prices will eventually return sustainably to levels of 2002 in due course. They believe that a great volume of new global oil production will start to appear and prices will be driven back to the cheap levels of last decade. Many who take this view also believe that market manipulation and inflation largely account for the high price of oil and that once reflationary programs like quantitative easing (QE) come to end, the price of oil will lose its speculative bid.
To be sure, the prospect for significantly higher prices in the near term remains dim. The automobile-highway complex is in full retreat in the West, and the developing world is largely funding its next leg of growth not through oil but via natural gas and coal. Short of war, an oil spike of the kind seen in 2007-2008 will not occur until global growth resumes.
That said, the factors contributing to oil’s present stability are worth considering as the foundation for any crash lower – or spike higher – in the year ahead.
Oil’s Current Price Envelope
Autumn is typically a time for financial market crashes. Should the Federal Reserve or the European Central Bank (ECB) waver from their implied promise of more QE, there is not enough organic demand in the global economy to maintain even the current stall speed of international trade and industrial growth. Any return to austerity or move away from reflationary policy would quickly sink asset prices. And that would quickly flow through to demand for oil.
However, QE does not in itself raise oil prices. If the global economy were “normal,” then QE would certainly flow through more directly to oil prices. (If the global economy were truly normal, there would be no QE). But the global economy, and especially Western economies, exited normal four years ago. During the present phase, therefore, QE is largely a psychological inducement and has few, if any, structural implications. QE functions more as a behavioral trigger, preventing economies from falling below their current level of stagnation. Accordingly, QE does not increase the price of oil during a time of debt deflation. Rather, QE simply maintains the global economy at the drip-feed level, thus allowing the OECD and non-OECD to continue their respective decline and advance. The result is a kind of stasis between oil supply and oil demand.
Unsurprisingly, the price of oil has been stable and has oscillated around $90 for nearly two years. A technical analyst might call this a consolidation of previous re-pricing phase, and fundamentally speaking, this is probably accurate. Recently, Ambrose Evans-Pritchard of the Telegraph newspaper marveled that oil prices could be “so high” during such difficult economic conditions:
Goldman Sachs said the (oil) industry is chronically incapable of meeting global needs. “It is only a matter of time before inventories and OPEC spare capacity become effectively exhausted, requiring higher oil prices to restrain demand,” said its oil guru David Greely. This is a remarkable state of affairs given the world economy is close to a double-dip slump right now, the latest relapse in our contained global depression...Britain, the eurozone, and parts of Eastern Europe are in outright recession. China has “hard-landed”, the result of a monetary shock and real M1 contraction last winter. The HSBC manufacturing index fell deeper into contraction in July...So we face a world where Brent crude trades at over $100 even in recession.
(Source)
Yes, the price influences on oil that exert upward pressure are mostly balanced by the array of factors exerting downward pressure. But this is all taking place at the new, higher price level for oil. Let’s take two of these factors, just to start. First, OPEC spare capacity, from EIA Washington:
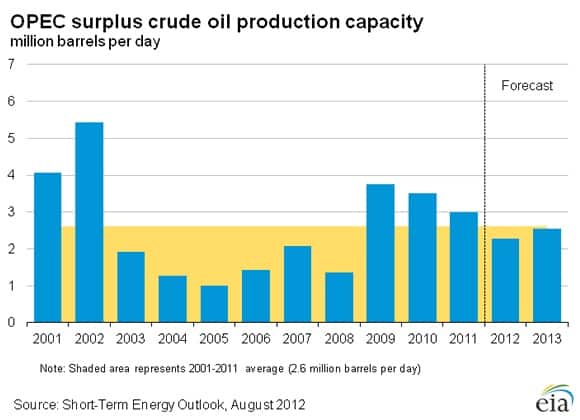
It is axiomatic that if OPEC increases production, then its spare capacity will fall. And that is exactly the trend that’s been unfolding since 2009, when a weak economic recovery began. While total OPEC production has remained largely within a range of 31-33 mbpd (million barrels per day) for years now, spare production capacity in OPEC has fallen for a third straight year and remains below the five-year average in 2012.
Oil markets always have (and always will) firm up prices when spare capacity falls because reductions in spare capacity simply make overall conditions ‘tighter.’ While I disagree with the Goldman analyst cited above that inventories or capacity will cause an imminent higher price squeeze, it’s absolutely the case that the lack of robust spare capacity in OPEC is supportive of price. Briefly, let’s take a look at OPEC production:
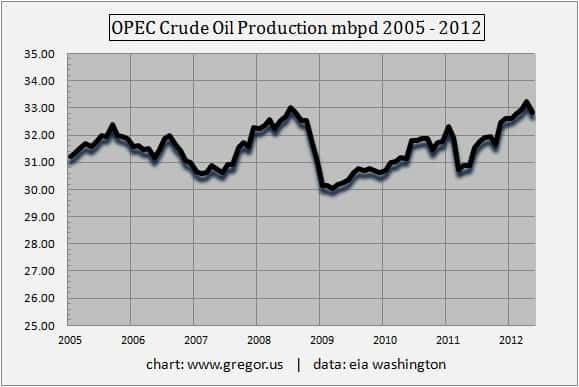
The increase in OPEC production since early 2011 has a paradoxical effect: Yes, more oil comes to market, but spare capacity is reduced by an equal amount. Meanwhile, there is no spare production capacity among non-OPEC producers.
Global oil markets are therefore efficient price discounting mechanisms: OPEC spare capacity, whether being utilized or held in reserve, is, at most times, priced in. (The singular wild-card to OPEC spare capacity is now Iraq, which I will address in Part II).
The Other Half of Global Supply: Non-OPEC
The incremental, post-2009 increases in OPEC production (coming from a low near 30 mbpd) along with the ability of non-OPEC to either maintain or slightly increase production – especially from the U.S. – has likely served to keep prices from running away to the upside. Again, these increased volumes of oil from both OPEC and non-OPEC are not enough to meaningfully lower prices. Rather, in a world where emerging-market demand growth balances developed-market consumption decline(s), these incremental additions to global supply are merely enough to restrain prices.
Let’s take a look at non-OPEC production:
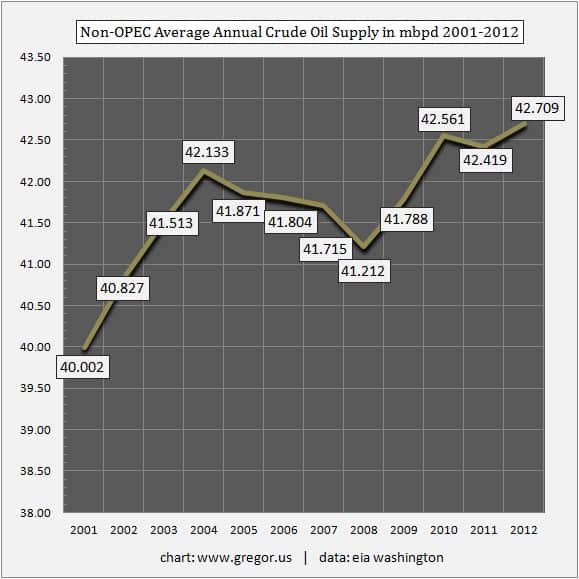
The near-mania over the recovery in U.S. oil production continues to run at very high emotional levels, but as we can see, average non-OPEC production in the three years of 2010, 2011, and 2012, (at roughly 42.5 mbpd) is just one percent above the average high of 2004. The fact remains that non-OPEC oil production is composed of very uneven results from various producers. Many of these have long offered the promise of increased volumes but have turned out to be a disappointment. Brazil is a case in point, where oil production is stagnant and not growing. Meanwhile, Canada remains at least 4-5 years behind projected growth rates from last decade, and other non-OPEC producers continue to suffer declines in places such as Mexico and the North Sea.
Marginal Price Realities
The oil market now understands that should prices fall below $90, it starts to make sense for large integrated oil companies to simply buy oil on the open market for refining rather than spending the capital to develop the oil from the ground. The cruel math of the marginal barrel now means that prices must stay above the $90 mark to encourage investment in new supply.
Furthermore, the rate at which this new supply comes to market remains ploddingly slow. Recent forecasts, such as Leonardo Maugeri’s wildly cornucopian report, completely overstate the rate at which new supply will come to market and the rate at which existing supply is in decline.
More broadly, the public still seems not to understand that many of the giant, integrated oil companies are now mostly price-takers of oil, not price-makers of oil. ExxonMobil, Shell, and ConocoPhillips have increasingly become natural-gas-focused companies as they lost their ability to replace their own oil production with new supply over the last decade. The new oil resources which come on-stream now are made possible by the small and mid-sized oil companies, which are more nimble and more suited to the tight, narrow boundaries that define the next tranche of oil supply. Global oil supply was once composed of giant companies extracting huge volumes from singularly giant fields. Now the landscape has fractured into a million little pieces, with specialists far and wide digging up expensive, hard-to-extract oil.
OECD Inventories
When new supply comes online at very slow rate against existing declines, one of the sources upon which the market can draw is inventory.
Based on the number of days' supply, total OECD inventories are back down near their lowest levels of the past four years at 57 days' supply. Readers will recall that the IEA Paris cited these inventories when the Libyan conflict broke out last year, as a reserve of oil that would be sufficient to calm oil markets. Not so. Oil markets were not pacified at all by inventories, which have been in a downtrend for over two years:
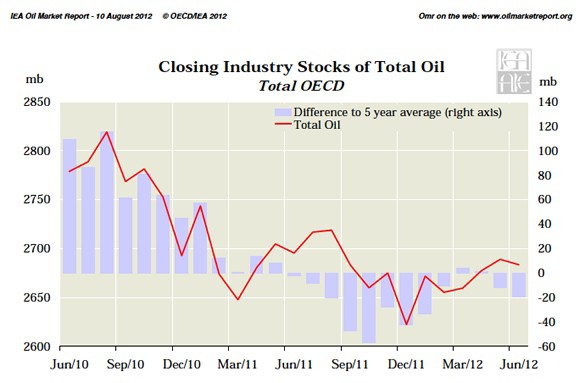
For over a year, inventory levels have been below the trailing five-year average. Per the most recent Oil Market Report from the IEA, inventories fell again, counter-seasonally.
Frankly, it is not so much that OECD inventories are at critically low levels, or that inventories are falling rapidly. Rather, the point is that inventories are not building. Indeed, on an absolute basis, OECD inventories at 2,683 mb (million barrels) revisits similar levels from 4-6 years ago (2006-2008). This is yet another reason why stagnating economic growth in the West has not exerted much downward pressure on global oil prices.
Energy Transition and the Next Set of Risks to Oil Prices
Global growth, scarce though it may be, is no longer being funded by oil. OECD economies have rebounded weakly since 2008, and have used natural gas, coal, and renewables like wind and solar rather than oil to build back broken portions of their economies. Meanwhile, in the non-OECD, where oil demand is still growing, the consumption of oil is completely dwarfed by coal consumption. There is no question that energy transition is underway and has been already for at least five years. In my last report, I suggested that one possible pathway for oil was to be finally set free to achieve significantly higher prices as the construction fuel for a world in transition.
In Part II: The March to $200+ Oil, we take a look at the various factors (and the relative influence of each) that are combatting to push oil outside its current price range: lower, as a result of renewed deflation and financial crises, and also higher, as a result of a near-term growth spurt brought on by renewed reflationary operations.
Click here to read Part II of this report (free executive summary; paid enrollment required for full access).
This is a companion discussion topic for the original entry at https://peakprosperity.com/the-repricing-of-oil/