When looking at residential real estate, we often tend to focus almost solely on recent price movements in assessing the health of the housing market at any point in time. But as both homeowners and income-earners in the larger economy, of which the housing market is an important component, to really understand what's going on, we need clarity into the larger cycle driving those price movements.
The more we look at today's data, the more it looks like that we are in a new type of pricing cycle -- one that homeowners and housing investors have no prior experience with.
And the more we learn about the fundamentals underlying the current cycle, the harder it becomes to justify today's home prices on any sustained level. Meaning a downward reversion in home values is very probable in the coming years.
Housing & The Economy
Housing construction has been meaningfully additive to overall US GDP in virtually every economic expansion cycle on record. Moreover, sales of home furnishings, appliances, landscaping and gardening equipment, etc. have contributed to expansion in consumer spending, the largest singular component of US GDP. And maybe most importantly, residential real estate investment has been a key wealth-generation asset for the middle and lower classes for decades.
Residential housing has typically been purchased with leverage that has been paid down over time accompanied by a commensurate increase in household equity as homeowner’s age and mortgages are paid off. Particularly for the middle and lower classes, residential real estate investment has been the single largest contributor to net worth expansion of any household investment asset class.
With the clarity of hindsight, we know that the prior 2006-2009 period witnessed the most serious downturn in residential real estate prices in a generation. Few saw it coming as it was an event never experienced in their lifetimes. One would have to travel back to the 1930’s Depression period to find a similar occurrence. There is an old saying in the markets -- People don't repeat the mistakes of their parents, they repeat the mistakes of their grandparents -- and this was certainly true in residential real estate markets in the middle of the prior decade, as the buildup of excess and often reckless leverage was ultimately the key provocateur leading to price declines, as was the case in the 1930’s.
Recovery At Last (?)
Accompanying the current economic expansion that began in June of 2009, residential real estate prices have recovered. In fact, in high-ticket geographic areas such as many parts of the San Francisco Bay Area, New York, etc, current prices have well exceeded the prior cycle peaks of 2006.
Indeed, the following chart (using data from the US Census Bureau) shows us that the median price of a single family home in the US has now recovered to a level just above the prior cycle peak:
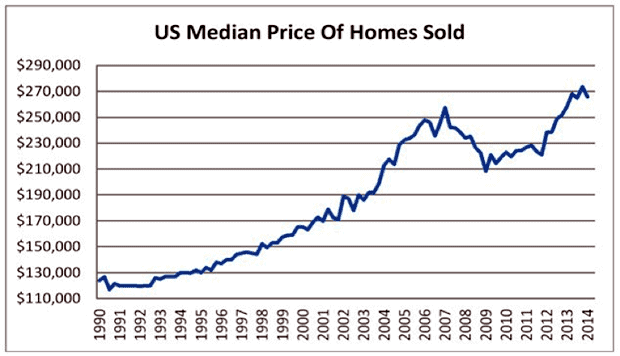
Remember, this incorporates meaningful and often anomalistic sales activity in very high priced areas such as New York and San Francisco, clearly skewing the median numbers higher.
In one sense, the recovery in price is at least graphically pleasing and simplistically suggests a return to longer term normalcy, or trend, in the overall residential real estate market. But as we look a bit deeper beyond just price into the important components of housing activity as they relate to the real economy (GDP) and household balance sheets, we see something very different: as the prior cycle downturn was a once-in-a-generation event, so, too, is the character of the current housing recovery. The anomaly of the current recovery has implications for both the real economy and investment activity ahead.
In headline fashion, the contribution of housing to US economic growth is found in new home sales and housing starts. Demand for new homes drives demand for building materials and construction work, both important in prior cycles in driving job growth, the bedrock foundation for consumer spending. Again, if one only looked at residential real estate price trends, one would assume a very normal recovery.
The Data Tell A Much Darker Story
But the data below show us that actual new home sales and housing starts currently rest very near half-century lows. How can this be? What we see at present with new home sales and construction starts is what we saw at the depths of every US recession of the last 50 years. These data points suggest that the current is anything but a normal housing recovery.
Here are the numbers are current through April of this year:
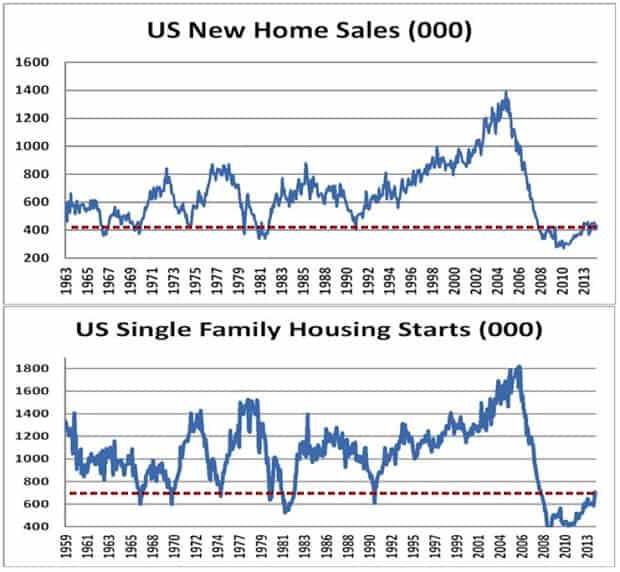
(Source: US Census Bureau)
Accompanying the dearth of new home sales and starts is the fact that the number of new mortgage purchase applications currently rests near the lows seen since 2009. Just how can prices be ascending so spectacularly when new home sales are in prior recession territory, new housing starts have not recovered, and the number of new mortgage purchase applications has not climbed from the depths seen in 2009-2010?
Accompanying these trends is the fact that the US homeownership rate post the peak seen in 2004 has fallen to a near 19-year low. The message is that although total household formation has marched forward, households are increasingly choosing to rent their primary residence as opposed to own residential real estate. Of course, this is the reason that median rents in the US, seen in the bottom clip of the next chart, have incrementally marched to new all-time highs:
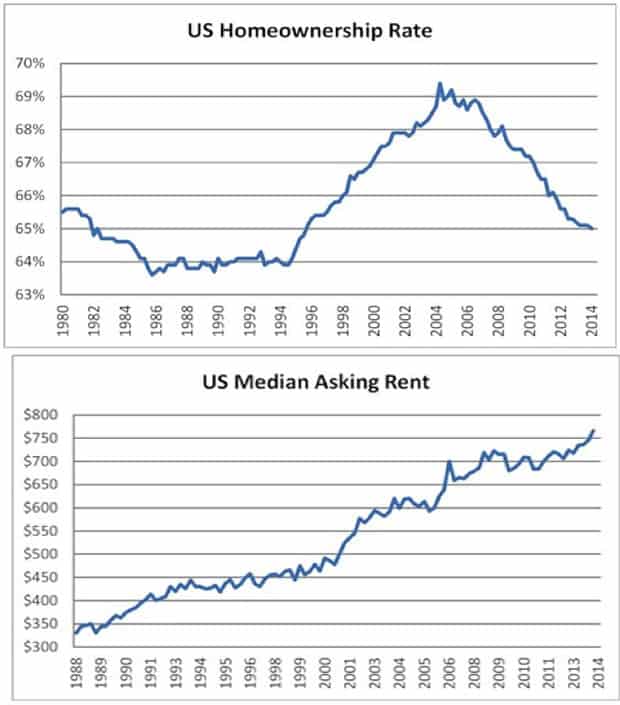
(Source: US Census Bureau)
How Will This Contradiction Resolve?
The key macro conclusion of the current cycle is that we are not witnessing a “normal” residential real estate recovery at all, but rather an investment cycle driven by actions of central bankers (think the Fed), global flows of capital, and a new entrant to the residential real estate market from the institutional investor side.
In Part 2: Get Ready For Falling Home Prices we identify the new primary drivers of home values in this unfamiliar pricing cycle and examine their implications for the broader economy, and household consumers specifically, as we look ahead.
Long story short: price reversion is coming. If you own housing as either a residence or an investment, don't let yourself be caught as vulnerable as you were in 2008.
Click here to access Part 2 of this report (free executive summary, enrollment required for full access)
This is a companion discussion topic for the original entry at https://peakprosperity.com/the-us-housing-markets-darkening-data/