 In the spring of 2011, when Libyan oil production -- over 1 million barrels a day (mpd) -- was suddenly taken offline, the world received its first real-time test of the global pricing system for oil since the crash lows of 2009.
Oil prices, already at the $85 level for WTIC, bolted above $100, and eventually hit a high near $115 over the following two months.
More importantly, however, is that -- save for a brief eight week period in the autumn -- oil prices have stubbornly remained over the $85 pre-Libya level ever since. Even as the debt crisis in Europe has flared.
As usual, the mainstream view on the world’s ability to make up for the loss has been wrong. How could the removal of “only” 1.3% of total global production affect the oil price in any prolonged way? was the universal view of “experts.”
Answering that question requires that we modernize, effectively, our understanding of how oil's numerous price discovery mechanisms now operate. The past decade has seen a number of enormous shifts, not only in supply and demand, but in market perceptions about spare capacity. All these were very much at play last year.
And, they are at play right now as oil prices rise once again as the global economy tries to strengthen.
The Subordination of Cushing
Through the dominant force of its own demand, the US economy largely controlled the oil price for many decades. For years, it was common practice therefore to gauge world demand through the weekly updates to oil storage at Cushing, Oklahoma as well as total oil storage in the United States. If the US was demanding more oil from the global market, and thus either not adding to oil inventories or drawing them down, then a signal was given, pointing to future oil price strength.
But this dynamic began to break down coming into 2005-2007. That was the period when US oil demand -- because of rising prices -- began its current decline. Now that US oil demand is down over 12% from its mid-decade peak, the fluctuation of oil inventories in the US no longer drives prices.
The chart below shows that US inventories have been on an upward trend since 2005, and are now near decadal highs above 300 million barrels even though oil prices are back above $100:
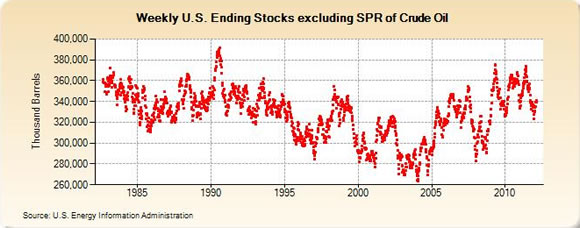
What we're now seeing is that US inventories and US demand are now subordinate to numerous other factors, ranging from emerging market demand, to market perception of spare capacity.
Lessons of Libya
A useful fact learned during last year's Libyan civil war is that Saudi Arabia does not necessarily possess the 2-3 mbd of spare capacity which most have assumed for years. Moreover, Saudi Arabia ceded the position of top world oil producer to Russia over 5 years ago in 2006. Indeed, Saudi Arabia made no production response to the loss of Libyan oil last spring. Producing near 9 mbd, it was only by June that Saudi production was lifted by 600 thousand barrels a day (kbd). That is a hefty production increase to be sure, but it raised questions as to how quickly spare capacity in the world can be brought online.
By the time Saudi Arabia had lifted production, the OECD countries led by the IEA in Paris had already decided to release oil from official inventories. But this, too, did little to calm oil prices -- and as I pointed out last June, only created further problems. In The Dark Side of the OECD Oil Inventory Release, I explained that, by lowering OECD inventories, the market would correctly deduce that safety buffers had been reduced further. Combined with the Saudi increase in production, this only reduced spare capacity further.
The result was even stronger prices as WTIC ran back to $100 (until all global markets floundered on a flare-up in the EU financial crisis). Indeed, it is no longer US inventories of crude oil but the fluctuations in the emergency cushion of all inventories in the OECD (of which the US is part) that is now the more important factor in oil prices:
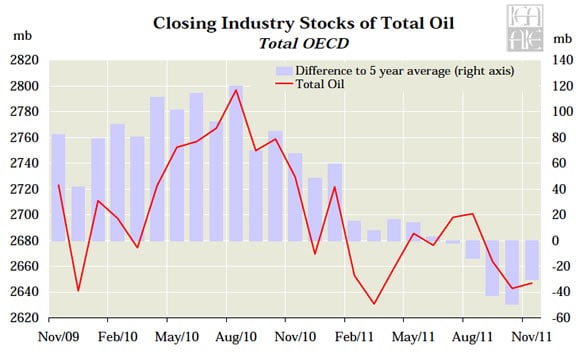
The loss of Libyan production caused a dramatic drawdown of OECD total oil stocks, which were already in a downward trend starting the previous summer in 2010. OECD inventories fell on both an absolute basis and on a comparative basis to the trailing 5-year average, as the above chart shows. Taking these inventories from a high of 2800 mbd to 2600 mbd onlysix months later, combined with unrest across the entire Middle East, was more than enough support to boost WTIC oil prices from $85 to above $100 last spring. Additionally, as we can see in the chart, the decline in OECD oil inventories was maintained into the end of 2011.
These are important conditions to consider when trying to understand how oil prices now, in early 2012, are once again on the rise.
The Decline of Spare Production Capacity
The latest global production data shows that Saudi Arabia was producing 9.4 mbd on average during 2011, an increase of 500 kbd over 2010. To accomplish this, The Saudis had to increase production from 9 mbd in 1H 2011 to 9.8 mbd during 2H of 2011. But paradoxically, this production increase has only made the global oil market even tighter, as spare capacity shrinks further.
Let's recall that nearly 60% of global oil supply comes from outside of OPEC from countries like the US, Canada, Brazil, Mexico, China, Australia, and the big producer, Russia. There is no spare capacity in this non-OPEC grouping, and there hasn’t been for years. Sure, there is oil to be developed in non-OPEC countries; but that is not production capacity (meaning it is not supply that can be brought online quickly).
Moreover, Russia, the country that single-handedly saved non-OPEC production from going into steep decline, massively increased its contribution to world supply in 2002. But in the past two years, it has seen its production growth taper off and flatten, to just shy of 10 mbd.
That leaves the oil market, tasked with the job of pricing, to figure out the ongoing mystery that is the "true" spare production capacity in OPEC. That it took 4-5 months for Saudi Arabia to increase production is a concern. Such delays should seriously give pause to those analysts who’ve regurgitated the belief over years that Saudi has 2-3 mbd that can be brought on quickly.
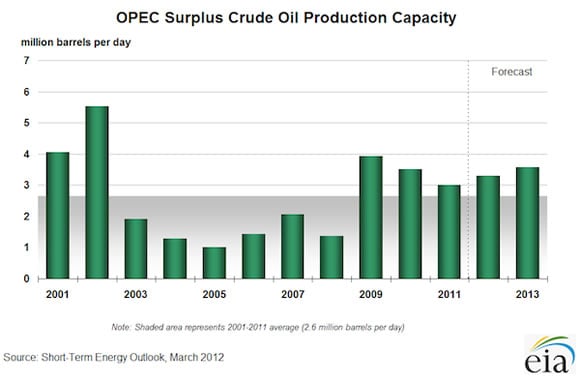
Although EIA Washington currently judges OPEC spare capacity to be higher than during the lows of 2003-2008, its historic figures show that spare capacity has been declining since a 2009 high.
Moreover, the failure of non-OPEC production to increase within last decade counts as a true surprise to the global oil market. The faith in non-OPEC supply over the last decade helped to keep prices subdued, until that faith was shattered by 2007's wild spike.
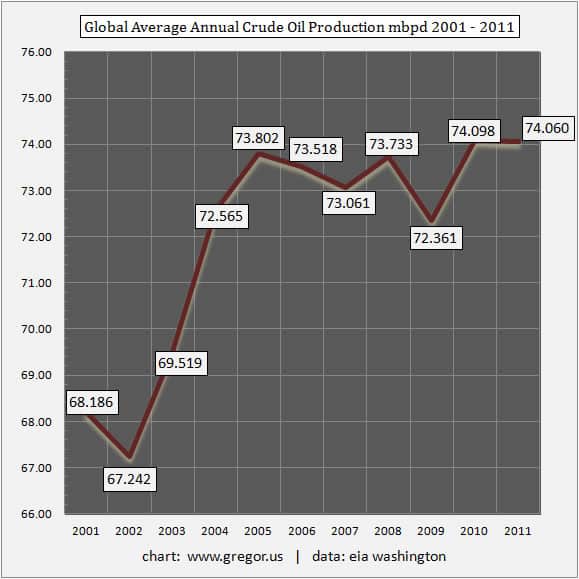
The problem now is that the oil market has been re-educated. Faith in the non-OPEC countries' ability to increase supply is no more. Meanwhile, the great deceleration in Russian oil supply growth has spooked the market. Combined, a market with 74 mbd of production and a theoretical spare capacity of 3 mbd simply creates too much uncertainty.
And consider this: the amount of total spare capacity is now equal to the 3 mbpd of demand that’s been taken offline in Europe, Japan, and the United States over the past 7 years, as oil prices have risen from $40 to the $100 level. Thus the oil market has quite correctly rationed supply, at higher prices. If prices were to fall to $50 or $60, the world’s lost demand could be rebuilt rather quickly.
Killing discretionary demand is now the proper function of the oil market in an age of flat supply growth.
Quantitative Easing and Granger Causality
We should also remember that the global economy would be mired in a textbook deflationary depression were it not for the continual and gargantuan US$ trillions that have been provided by central banks since 2008.
Early 2009 saw oil prices slip briefly below $40. But, of course, that's the price level appropriate to a world during an industrial crash -- with reduced shipping, halted economies, and dislocated consumer demand. The world can have those prices again, if it chooses. But it must also be willing to accept a global recession to achieve such low oil prices.
Thus, there is a misconception that currency debasement is the main driver of oil prices. However, given the new supply realities, that simply isn't true any longer.
The chart below is helpful in explaining why. There is no question that coming out of 2000, the decline of the US Dollar as expressed by the USD Index was a true component of the rising oil price. During that period, as the USD was falling, global oil supply was still increasing. The descent of the US Dollar was unquestionably part of the repricing process, as the USD Index fell from a high of 120.00 in 2002 to 80.00 in 2005:
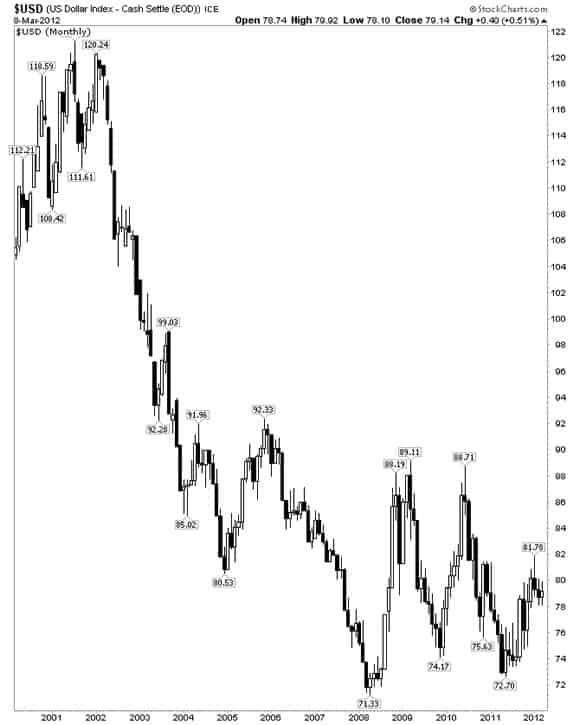
But see how the most ferocious part of oil’s price advance started to unfold after 2005, when, as the USD continued falling, the global supply of oil stopped growing.
If we think of this comprehensively, we have to conclude that the debasement of currencies is no longer the primary factor in the price of oil on a valuation basis. Rather, it is that quantitative easing prevents a deflationary industrial collapse, thus keeping the global economy alive and able to consume more energy.
We can therefore say that in our post-credit bubble collapse era, and with global oil supply now flat, that quantitative easing causes higher oil prices (through Granger causality). It keeps economies from collapsing (for now) and thus brings demand up against very tight supply. As we can see from the chart above, the USD Index has for 3 years now been bouncing off the bottom it first reached in 2008. In a way, this is helpful because it brings to light the new dominant factor in global oil prices: supply.
Supply is Now Primary
Supply and the recognition of supply are now the dominant factor in the oil price -- a point so obvious, it hardly seems worth making. However, the developed world is still largely operating on the classical economic view that higher prices will make new oil resources available.
That is true. But, it’s just not true in the way most anticipate.
While higher prices have brought on new supply, these resources have been slow to develop, are more difficult to extract, and generally flow at lower rates of production. As the older oil fields of the world decline, the price of oil must reflect the economics of this new tranche of oil resources. There are no vast new supplies of oil that will come online in 2013, 2014, and 2015 at the scale to negate existing global declines.
During the entire time that global oil supply has been held at a ceiling of 74 mbd, since 2005, a lot of new production in the Americas and Africa especially has come online. But it has not been enough to increase total world supply. And the price of oil has finally started to price in that new reality.
Here Comes Volatility in Oil Prices
The pricing dynamic discussed above is accentuated by the crisis cycle: the repetitive oscillation between acute and chronic phases of the ongoing debt crisis, mitigated by central bank reflationary policies.
In Part II: Get Ready for Oil Price Volatility to Kill the 'Recovery', we forecast how today's protractedly high recent oil prices are already sending a signal that a new hit to global demand is underway.
Generally, it appears that the oil price is making its move too early in the year -- which will likely serve as a sucker punch to the fragile world economy -- thus making spectacularly high prices before year end less likely, and a sharp market correction and return to economic recession more so.
Investors will be wise to take prudent precautions before this nasty wake-up call arrives.
Click here to access Part II of this report (free executive summary; enrollment required for full access).
This is a companion discussion topic for the original entry at https://peakprosperity.com/understanding-the-new-price-of-oil-2/

