Why Gold Is Undervalued

Gold has been in a bear market for three years. Technical analysts are asking themselves whether they should call an end to this slump on the basis of the “triple-bottom” recently made at $1180/oz, or if they should be wary of a coming downside break beneath that level. The purpose of this article is to look at the drivers of the gold price and explain why today’s market value is badly reflective of gold’s true worth.

First, I think a reminder would be timely. Those who seek to trade gold are at substantial disadvantage:

  • they line themselves up against too-big-to-fail banks which have the implicit backing of the taxpayer to bail them out of their trading positions;
  • furthermore markets have become so manipulated and dangerous that gold should be considered as insurance against systemic risk instead of a punt.
Because the majority of market investors don't fully grasp these risks, when the current global financial bubbles eventually burst, there will only be a tiny minority who end up possessing gold -- by which I mean physical gold held outside the fiat money system.

Technical Analysis & Gold

Using charts has the theoretical advantage of taking the emotion out of trading. So long as there is no significant change in the purchasing power of the currency against which it is traded, prices in the past have relevance to the future, because recent price experience sets an expectation in the human mind. The chart below shows the gold price since the peak in September 2011.

The chart shows a potential triple-bottom pattern formed over fifteen months, at just over $1180/oz. We know that the three bottoms were all at quarter-ends, strongly suggestive of price manipulation to enhance bullion bank profits and their traders’ bonuses. In each case, computer-driven traders had near-record short positions evident in this second chart, of Managed Money shorts on Comex:

This confirms that $1180/oz appears to be the point of maximum bearishness, in which case our triple-bottom pattern should hold.

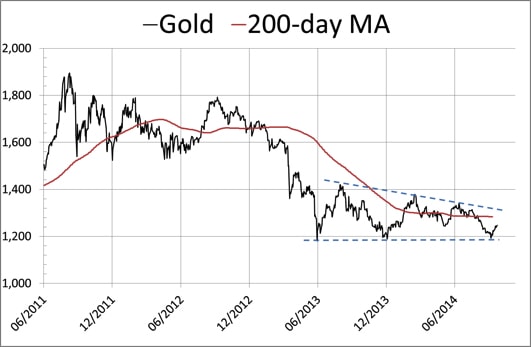
However, this pattern is rare and should not be the first conclusion we jump to. The definitive work on Dow Theory (Technical Analysis of Stock Trends – Edwards & Magee) describes an unconfirmed triple bottom as “treacherous”. But the characteristics we’re seeing in this current formation, with the third low on low volume and the subsequent rise on improving volume, are encouraging. Confirmation of the pattern according to Edwards & Magee requires the gold price to move above $1375, a level worth noting. Once confirmed, a triple-bottom “almost always produces an advance of distinctly worth-while proportions.”

The danger of course is non-confirmation. One can imagine a price rally to say, $1300, unwinding the shorts, at which point subsequent bears might then mount a successful challenge on $1180.

Additionally, since Edwards& Magee published their work, computers have allowed us to define trends by moving averages, and a commonly accepted indicator is the 200-day MA, which stands at about $1280. If that level is broken and the gold price stays above it long enough to cause the MA to rise, that should trigger computer-driven buying. So any price over $1300 will likely confirm the bullish case, yet it would be a mistake today to be unreservedly bullish on technical grounds alone until this price level is exceeded.

Valuing Gold

None of this reins in the truly subjective nature of tomorrow’s prices. Instead, we should turn to relative valuations to get a sense of whether gold should be bought today or not.

To do this, we need to compare the quantity of gold with the quantity of fiat currency. While we have reasonable estimates of the total amount of above-ground gold stocks over the last few centuries, we really don’t know how much the central banks actually hold, on the basis their figures are for “gold and gold receivables (i.e. leased, loaned or swapped and not in their physical ownership). Equally, the task of assessing the true total amount of the world’s fiat currency and how that has grown over time is too great to be a practical proposition.

Instead, I have devised a simple and practical approach, by comparing the increase in the world’s above-ground gold stocks with a measure of the increase in the quantity of USD fiat currency.

I’ve devised a metric called the “fiat money quantity” (FMQ) which reverses the process by which fiat money was originally created. Our forebears’ gold was taken in by commercial banks, which would issue currency notes and record deposits in gold substitutes (dollars payable in our forebears’ gold). When the Fed was created, the Fed took in the same gold from member banks and issued its notes and recorded reserves against that gold in its balance sheet. So FMQ is the total of cash, accessible deposits in the commercial banks and bank reserves held at the Fed, adjusted by temporary factors that affect those reserves such as Repos and Reverse Repos. More details on how FMQ is calculated can be found here.

The chart below shows how FMQ has grown since 1959. It shows a steady rate of exponential growth prior to the Lehman crisis, after which it has increased alarmingly:

One glance tells us that USD fiat currency is in monetary hyperinflation, which is not reflected in official price inflation statistics (but that's another story). Our objective is to try to get a feel for whether gold is cheap or dear, and the next chart shows how the gold price has progressed from the month before the Lehman crisis (nominal gold price in red, FMQ-adjusted price in yellow):

The message could not be made more clear: compared with fiat dollars, in real terms gold has fallen in price since the Lehman crisis despite the increase in its nominal price. With gold at $1200 recently, it has actually fallen by 41% in real terms from July 2008.

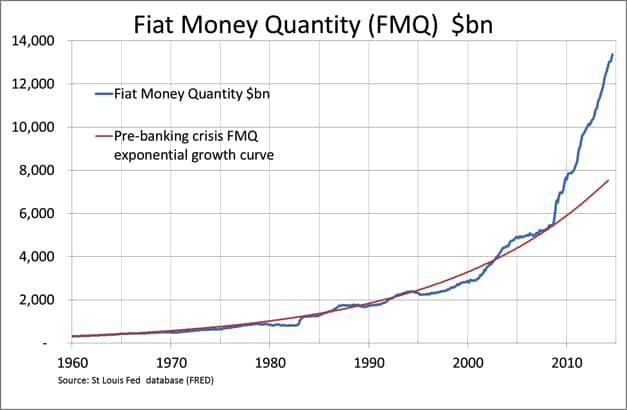
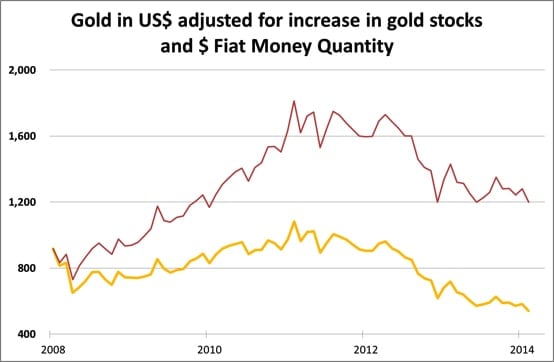
So to summarize, before the Lehman crisis, investors’ appreciation of systemic risk was relatively low. After the crisis, there were concerns that we faced a deflationary price contraction, so the nominal price of gold dropped (from $918 to $651). When it became clear the Fed would successfully inflate the financial system out of immediate trouble, gold rose to its high-point in September 2011 – but on an FMQ-adjusted basis the high was considerably less, reflecting the sharp increase in the quantity of new fiat money being issued: gold only rose about 20% from July 2008 on this basis. While there was undoubtedly some froth in the gold price at this point that needed correcting, given the circumstances the price level was otherwise reasonable. The subsequent bear market in gold since has taken it to an extreme undervaluation today.

Gold is not alone in having a market value divorced from reality. A bankrupt government such as Greece has had no problem borrowing 10-year money recently at only 6.5%, though this anomaly is beginning to correct. Other insolvent nations, such as Spain and Italy were recently able to borrow 10-year money as low as 2% and 2.2% respectively, though their bond yields have also subsequently risen slightly.

Think about this for a moment: the US dollar is the reserve currency and its government bond yields are the benchmark for global fiat money risk-free return. Governments with a demonstrably (much) worse borrowing record have been able to issue bonds at what amounted to a yield backwardation – significantly lower than the US 10-year Treasury bond. This has never happened before, so far as I’m aware.

Key market valuations are totally screwed up in a world of 0% interest rates and manipulated markets. If gold was alone in its extreme undervaluation, without a counterbalancing overvaluation in fiat-currency bond markets, something would probably be wrong with our analysis. The fact that this is not the case offers confirmation that gold is mis-priced and incorrectly valued in markets that have become divorced from reality.

Defining the Gold Market

It is common knowledge that dealings in paper gold are greater than that in physical bullion. Paper gold includes the following categories:
  • Unallocated gold accounts held with bullion banks.
  • Sight accounts held with central banks on behalf of other central banks.
  • Over-the-counter derivatives and options
  • Forwards on the London market (deferred settlement never intended to settle)
  • Regulated futures markets (Comex, Tocom etc.)
  • Gold ETFs not backed by physical gold.
The total of these markets, for which there is no estimate, is simply enormous (by contrast GoldMoney estimates above-ground stocks of physical bullion total some 162,500 tonnes today, increasing at about 2,800 tonnes per annum.)

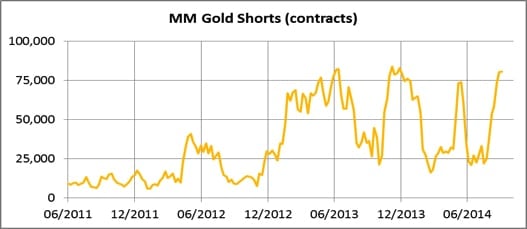
But we can get an idea of the overall interest in paper gold from numbers released by the Bank for International Settlements covering off-market derivatives, plus outstanding Comex interest. This is shown in the next chart:

The last data-point was end-2013, when gold coincidentally sank to $1180 for the second time. A significant portion of these derivatives can be expected to be hedges against bullion-bank liabilities such as unallocated accounts and perhaps positions in regulated futures, so they are a fair reflection of changes in outstanding paper interest. It is clear that over the course of the last thirteen years, in terms of tonnes equivalent, total gold derivatives have declined significantly. Some of this decline has been due to the increase in the gold price so the currency value of these derivatives would not have fallen so much; but from the peak in 2011 from which the gold price has fallen by nearly 40% in USD terms, outstanding paper gold has certainly accelerated gold’s decline.

This tells us that, given that their hedge positions are historically low, bullion banks have reduced their outstanding liabilities to customers with unallocated accounts, which would be consistent with the late stages of a bear market. Ironically, the unwinding of unallocated accounts has been hastened by the withdrawal of bullion from the London market redeployed to satisfy Asian demand, because ultimately physical bullion is the basis for the whole market. It is obvious that if the trend outlook for gold improves, given that the decline in outstanding derivatives has not led to reducing leverage on the physical market, liquidity could rapidly become a serious issue.

Meanwhile, physical gold goes from West to East.

Asian Demand

Physical gold features in the family pension fund for the average Asian. We are all familiar with this being the case for Indians, but it is also true for most other countries on the continent. The reason is simple: no Asian government has been able to suppress the ordinary citizen’s interest in gold as a store of wealth, and generally currency issuance has been badly abused by Asian governments. For example, in Turkey accumulating inflation from the 1980s led to six noughts being lopped of the lira in 2004. In India, since the 1960s the rupee price of gold has gone from INR160 to about INR76,000 per ounce today.

The history of Asian demand goes back to the oil crisis in the 1970s, when the Middle East suddenly became immensely wealthy from the rise in the price of oil. Naturally, they invested a portion of their new-found wealth in gold. The pace of gold acquisition by Arabs slowed in the early 1990s, because a new western-educated Arab generation began to manage the region’s financial resources, and these youngsters were doubtless discouraged by gold’s prolonged bear market. Instead they turned to equity markets and infrastructure investment. Then in 1990 India repealed the Gold Control Act.

This legislation banned Indians from owning gold in bar and coin form, which gave added impetus to smuggling and jewellery manufacturing. Its repeal was part of a process of economic liberation in the wake of a financial crisis which led to market-friendly economic reform. Since then, recorded private sector imports grew from a few hundred tonnes to as much as 1,000 tonnes annually before the Reserve Bank of India reintroduced import controls last year. Predictably the effect has been to restrict officially imported gold and increase smuggling.

Turkey is the gateway to Iran and the Moslem world to the east beyond the Caspian Sea. Gold has been actively used as money by this region since time immemorial. According to the Borsa Istanbul, Turkey has imported 3,060 tonnes of gold since 1995. Some of this has gone to Iran and to the east of Turkey, but equally the rest of the region will have had other sources over the decades. Lastly, South-East Asia is populated with a Chinese diaspora, and since its industrialization in the 1990s this region has also been stockpiling significant quantities of bullion. But the big story is China itself, which we investigate in detail in Part 2 of this report

Summary (Part 1)

When the gold price is being smashed in western capital markets, it's easy to forget that Asia is quietly buying up not only all or most of its own mine and scrap supply, but significant quantities of the above-ground stocks held in western vaults as well. It's a process that dates back to the birth of the petro-dollar in the 1970s and has continued ever since. The three big ownership centers are the Middle East, India and China -- the latter two having in recent years enjoyed high rates of economic expansion, with increasingly wealthy middle-classes with a high propensity to save.

We cannot know in truth how much of the world’s above-ground stocks of gold are in the hands of these three centers. But they are only part of the Asian story, with Turkey and its sphere of influence plus the whole of South-East Asia, whose people also regard gold as a prime savings medium. All we can say is that it is likely that significantly more than half the world’s gold is in Asian hands. Importantly, over the last ten years the pace of Asian accumulation has increased, draining the west of its physical liquidity. And in this respect perhaps the most important indicator is the decline in outstanding OTC derivatives shown in the last of the charts above.

So not only do we have evidence that the price is based on western paper markets with declining liquidity, but by comparing above-ground stocks with the Fiat Money Quantity of the world’s reserve fiat currency, we can see that gold is extremely undervalued at a time of high, possibly escalating systemic and currency risk.

In Part 2:The Case For Owning Physical Gold Now we delve more deeply into the flows of bullion to Asia which will soon create supply shortages in the West, as well as detail the growing systemic and currency risk factors that few asset besides physical gold can offer protection against.

Click here to access Part 2 of this report (free executive summary; enrollment required for full access)

This is a companion discussion topic for the original entry at https://peakprosperity.com/why-gold-is-undervalued/

So is the FMQ a reasonable deflator/replacement for the CPI?
FMQ = CURRENCY + RESBALNS - RESBALREQ + TCD + SAVINGS

Here they are together.  Does anyone remember 51% inflation in the early 1980s?  How about 30% inflation back in 2010?  Does this pass the sniff test?

Not to me it doesn't.  Even Shadowstats isn't suggesting we had 30% inflation in 2010.  The problem with this approach is, price inflation is not driven strictly by a simple measure of money supply.  The economy is far more complicated than that, so using a simple money supply growth rate as a deflator for gold (to come up with a "fair market value") seems like a flawed approach to me.

Here is a chart of gold, deflated by the standard CPI, which we all know is flawed, going back to 1975.  CPI uses 1983=100 for the index, so price for gold is in 1983 dollars.  CPIAUCSL right now is 237.  My gut says price inflation was higher than 2.3x over the last 30 years.  It puts the peak of gold in 1980 in a different perspective.

Now here's the same chart using FMQ as the deflator.  FMQ was 1 trillion dollars back in 1983, and is about 13 trillion right now.  Do things really seem 13x as expensive as they were back in 1983?

My sense: FMQ is not a good deflator to use.  Then again, neither is the CPI.

Of the top 3 gold producers in the world. Two are losing money and one is breaking-even. Can't make up those fundamentals.

To help save the Sheeple from the Central Bank's monetary steam roller… here is my performance art interpretation of such;
 

http://www.youtube.com/watch?v=mMdqvmCPj_I

Dave, your argument is persuasive but left me hanging.  If neither Alistair's FMQ nor the CPI are accurate deflators to the price of gold, what is?  ShadowStats inflation numbers? Something else? Or maybe such a tool doesn't exist?

Jim,

I was curious about the video, but it seems to have been removed. Hope all is well.

It may be a vimeo vs. youtube thing…
 

http://vimeo.com/109169719


Dave,

What would you suggest is a natural gold/dollar level?

terrific

terrific

Great article Alasdair. Lots of graphs and geopolitics to consider but for me the case for owning gold and other physical assets is as follows:
Q. Does all fiat currency have to grow exponentially just to continue to exist? A. Yes

Q. Is all fiat currency backed by debt (also growing exponentially) that can never be repaid? A. Yes

Q. Therefore is this system unsustainable? A. Yes

Q. Therefore is it GUARANTEED that it will collapse at some point? A. Yes

Conclusion: Convert your fiat currency into physical assets, including gold while you still can.

Trun-Haha yeah I guess I told the joke but forgot the punchline.
I don't have an inflation indicator I like, at least not in a long-lived timeseries.  BPP is pretty decent, but it is relatively new.  Perhaps if I added shadowstats to CPI and then divided by two?  Could it be that simple?
Another issue I have with FMQ is that money supply isn't a good metric for gold, not by itself.  At a minimum it needs to have "velocity" attached - a chest containing a billion dollars sitting in a basement for 20 years adds to money supply, but doesn't contribute to inflation.  "Excess Reserves" qualifies as a chest in the basement, as far as inflation is concerned.
Three approaches to "fair value" for gold:
There is the "theoretical value for gold" (i.e. if you backed each unit of "FMQ" money with an ounce of gold) - that puts a really large number on the price of gold.   Perhaps $55,000 per ounce.
There is also the "nice suit" rule - throughout history, one ounce of gold "roughly" buys a nice suit of clothing.  According to the "nice suit" rule, right now gold seems to be in the right ballpark at between $1000-$2000.
Then there's the practical approach.  What drives gold prices?
My research shows gold is driven by a combination of money supply of various countries, plus some level of credit panic, current inflation expectations, with gold supply and other investment performance (SP500) acting as a damper.  But then you need to add the price of silver to the mix, so you can end up getting all the spike highs.  Silver drives gold, especially when pushing gold out of its normal price band.  Without silver as a factor, its impossible to explain the spike highs.
After all my study, here is my conclusion: gold wanders around within its "nice suit" price band driven by inflation expectations in the West, and purchasing power increases in the East.  However, gold really pops because people freak out over something.  I don't think we were at "freak out" levels in 2011, but we definitely had inflation going, and China & India were running at full steam (China's money injection peaked in 2011, right alongside commodity prices of all sorts), and silver's rocketship move dragged gold up too.  Back then, everyone was buying gold, and people were worried money printing would lead to hyperinflation, and so gold had a really great time.  Now - China is cooling, so is the West, nobody is seeing any sign of hyperinflation, no matter how hard we look, and so gold is unloved, and it drops to the lower end of its "nice suit" price band.
Can gold remain below costs of production?  Sure.  For how long?  That's another question.  Eventually the high cost miners will go out of business and/or stop investing in expansion, and that will remedy the problem all on its own.
What will cause people to freak out?  Chris talks about a helicopter drop of money into the hands of real people - 2 years worth of taxes refunded to the taxpayers, printed up by the Fed.  That would do it.
I don't think QE4 would do it, however, since we now know that QE (sitting in Excess Reserves) doesn't cause general price inflation.
I suspect Greece or Italy leaving the eurozone might do it as well.

What will cause people to freak out?  Chris talks about a helicopter drop of money into the hands of real people - 2 years worth of taxes refunded to the taxpayers, printed up by the Fed.  That would do it.
I don't think QE4 would do it, however, since we now know that QE (sitting in Excess Reserves) doesn't cause general price inflation.

I agree that QE is not inflationary–since it goes into bonds, stocks, and real estate (backdoor channels), and basically is a lot of credit creation–or newly created fiat–sitting in the basement trunk not circulating or causing inflation (good analogy by the way).

But I disagree that QE4 can't cause people to freak out. Let me explain why.

Today's market is no different than the roaring 20s (except thus far there is little in the way of animal spirits). What happened in the 20s is exactly what is happening and has been happening over the last few years.

From 1921 to 1929 the Fed expanded their monetary base by 63%, or a little over 6% annualized. The money in circulation didn't increase but the base money exploded as deposits on the banks balance sheets (just like today). If that sounds familiar it is because it is familiar. The banks also got the green light from the Federal Reserve to loan money for stock purchases–it was more common than not for folks to have 10% in equity and 90% in margin as the stock market raged to unprecedented heights.

That is exactly what has been happening today–and the Fed has been giving everyone the green light to go all-in on the stock market, through communications, proxies, and the Presidents Working Group on Financial Markets (you know, the guys that have been buying all the stock market futures in market routs!). And indeed the Fed has increased it's monetary base to the most extreme levels in history today. The excess deposits, like the Roaring 20s, haven't made its way into circulation…but it has created another stock market monster as in the 20s. Things are always giddy on the way up, "you just gotta be in this market!" kind of bullocks.

The lesson is that the monetary expansion, as have shown over and over again throughout history, is not a cure or a remedy or fix-all. It is the opposite–it is the problem. It is the monetary expansions that actually result in the wide-scale devastation, destruction, and busts ultimately. The ones we have seen over the last 100 years through the lens of history and fact.

When the party ended in 1929, and though inflation was mild, those invested in gold preserved their wealth…while EVERYONE else lost just about everything, including their lives in many cases with images of folks jumping out of buildings coming to mind.

This is why despite their stoic postures during FOMC presentations, the Fed and the Central Banks are actually scared to death. As I am frankly, as I watch these charades unfold. The market WILL CRASH when the monetary expansions END at some point. That is the inevitable outcome. It is also why guys like Peter Schiff are right when they say "The Fed can never stop printing money." This is true if they in fact want to arrest the next great crash.

But the Fed has shown themselves to be completely unpredictable and in fact incompetent throughout every boom and bust. And that is why real investors–not speculators–are suffering mightily in these nightmare markets today.

We all KNOW there is something seriously wrong in our little hearts. While some can't pin-point it, as outlined above, it is the Fed itself that has caused the massive BOOMS and BUSTS that will haunt us for years and years to come.

It is hard to party like it is 1999 or 1929 no doubt. Because all parties come to an end. You don't need inflation to protect you with your gold stash. A complete crash either as in deflationary or hyperinflationary will both protect you. It is during these "roaring" times of monetary expansion where the money doesn't circulate–causing grand misperceptions–that is pure misery for all those that know the truth.

And if you are a money manager–you've been screwed with client perceptions of mediocre to crappy performance if you know the TRUTH that awaits us. It is the old adage, "the market can remain irrational longer than you can remain solvent."

Good luck all.

HeroineandHash

phecksel-I believe that markets and prices operate in trading ranges rather than having "natural levels".
My sense is that the "long term" lower end of the band is perhaps $1200, based on production costs, and that lower band is rising over time due to us being on the downslope of peak gold ore grades and peak cheap oil.  We might go lower than 1200 for a time on momentum trades or deleveraging, but not for too long - the more expensive miners would simply shut down production after enough time passed.
Upper end of the band (during "normal times") is probably $2000 or so; if we ever got the animal spirits of China and the West working at the same time again the way it was in 2011, it might be higher - perhaps $2500 or so.  Again, that band rises over time due to peak resources.
My feeling is, movement within the band happens due to changes in credit growth.  A big spike like in 2011 will lead to a big pop in gold,  A drop in the rate of change results in a drop in the gold price.
Roughly, credit growth = "inflation expectations" - but it needs to be credit growth that actually makes it into the hands of real people, not trunks of cash in the basement (i.e. Excess Reserves).  In 2010, credit growth in China was absurdly high - it showed up in Chinese M1 as a 39% increase, y/y.  10 years ago that wouldn't have mattered, but these days China's economy is big enough that it really moved the needle worldwide.
Now we can see that growth has really fallen off - its down to 7% these days, which reduced the gold-buying enthusiasm.  It is not about absolute M1 levels, but the change in M1 that drives inflation expectations, as far as I can tell anyway.
 

HH-


But I disagree that QE4 can't cause people to freak out. Let me explain why.

Eh, so I saw this claim of yours, and then everything you wrote that followed didn't really support the claim.  While the things you said were true, none of them actually supported your assertion that QE4 will be a dramatic event that will tell everyone "the party is over", "the jig is up", etc.  Your response was a claim followed by a lengthy non-sequitur. QE1 shocked everyone,  QE2 shocked people less, and QE3 was a bit of a ho-hum affair.  We now imagine that QE4 will shock everyone again?    

@Dave: It won't matter in the end if it is QE4 that shocks everyone or not. If there is a QE4, and there will be, it will ultimately just make the devastation much worse at some point–and people might or might not wake up to this grim reality on the announcement of QE4. The 64,000 dollar question is simply will America finally realize the last injection is truly never enough (as Stockman said)? I think it could wake folks up but…
Knowing Americans think in herd like ways, and considering how much captured capital there is in the system (401k's, Pensions, etc.), I suspect the party would indeed likely just continue under QE4 as we've known it—until the final and last great stock market collapse finally happens.

Of course, if there are payroll tax cuts and other transmission mechanisms to get money to the little guy—many will mistake this for awhile as a true recovery as the velocity of money finally picks up. So under that scenario, I don't think QE4 wakes up America–not for awhile, and then at some point the monetary expansion takes us to a period like the 70s, only much worse. All this is frankly speculation of course…

But what isn't speculation is that monetary expansion (QE) like this under any form, especially as extreme as this has been (which is why there will be no easy way out at this point), will be looked back upon as the great destructive force that it is. It will cause enormous issues at some point. What wakes people up to this I frankly don't exactly know–could be QE4, maybe not.

The only real prediction I have is what Bubba Lang once uttered on the eve of the fight when it came to his forecast about his upcoming fight: "pain."

One point I'd like to make about how all QE does is make the rich richer…well, that will remain to be seen. Far too early to be calling that IMO. What happens to the "rich" when their stock portfolios become worthless?

Of course, smart guys like Ray Dalio will remain rich since he already owns gold and everything else. I think it's the upper middle class that gets really roiled in the next stock market crash.


At any price above $456 per ounce gold is preposterously overvalued and that speculative froth will rapidly be blown off the top.
THE ISSUE IS THE PROPER PRICE OF GOLD.
An array of reasonable historical metrics can be used to establish the proper price of gold, including:

  1. Its historical mean which would put gold right around $456 per ounce
  2. Its 16:1 historical ratio against silver which would put gold right around $275 per ounce based on silver being around $17.17 per ounce
  3. Its inflation adjusted price today from its last stable historical price of $35 per ounce in 1971 which would put gold right around $400 per ounce.
  4. Its current official US government price of $42.22 per ounce which is how the approximately 8250 metric tonnes of US government gold are valued:
    http://www.fms.treas.gov/gold/current.html
    The Federal Reserve couldn't give the slightest hoot about gold as it is a trivial little collectible niche commodity that has ZERO FINANCIAL RELEVANCE and has a total value of  around $7 trillion for all of the gold that has ever been mined, and about 70% of which is in the form of jewelry widely dispersed around the world.


GOLD AND SILVER AMONG MOST TOXIC ASSETS OUT THERE…
Folks who bought gold at its manic speculative BUBBLE HIGH of $1927 per ounce in April 2011 have now lost $697 per ounce which is 36%, so if they put $100,000 in that overpriced yellow stuff back then, it would now be worth only $64,000 and they would now have a loss of $36,000 - or MORE THAN ONE THIRD OF WHAT THEY PAID - in just that short period of time.
Folks who bought silver at its preposterous and absurd BUBBLE HIGH of $50 an ounce in April 2011 have now lost $33 per ounce which is 66%, so if they put $100,000 into that gray stuff back then, it would now be worth only $34,000, and they would now have a loss of $66,000  - or NEARLY TWO THIRDS OF WHAT THEY PAID - in just that short period of time.
BEWARE OF TOXIC OVERPRICED METALS AS THEY HAVE FALLEN MASSIVELY, and will fall a lot further as gold plummets to its mean of $456 per ounce and silver plunges to its mean of $8 per ounce.


Jim Rickards says there are only 35,000 tons of gold in all the central banks. Since there are 32,151 troy ounces in one ton, that means central banks have 1,125,285,000 ounces; let's say 1.1 billion oz. That means that to back up international currency reserves with the gold held currently by those selfsame central banks, the price of an ounce of gold would have to rise to $10,900. 

What about it's current cost of production plus a reasonable return given the risk of investing in mining? If I'm not mistaken that is near or a bit higher than it's current price.  As ore grades continue to decline and fuel costs rise, the cost of production will only go up.
Nobody would mine the stuff at $456 per ounce.  Of course, given the destructiveness of mining to ecosystems and human societies, maybe it would be a good thing to stop mining it.