Why the Bullwhip Effect All But Guarantees Another Poorly-Handled Liquidity Crisis

I'm about to connect the Federal Reserve to beer. You ready?

The Bullwhip Effect

One of my more memorable moments in business school came during an Operations class. The topic for the day was the Bullwhip Effect, a very real and vexing phenomenon that occurs in forecast-driven distribution systems.

Essentially, when there are multiple parties in a distribution system, the imperfections in each player's forecasts (no forecast is consistently perfect) compound to wreak increasing havoc over time, even if demand stays relatively stable.

Grasping how this works is somewhat non-intuitive. So the professor had us play a game developed by MIT back in the 1960s that uses beer to make the point (thus guaranteeing our full attention).

The Beer Game

The Beer Distribution Game divided us into groups of 4 people each. Each person was assigned a role (factory, distributor, wholesaler, retailer). Our task was to meet downstream demand while trying to avoid costly inventory overages or backorders.

The game was played in rounds, and communication was limited to exchanging pieces of paper via which we either fulfilled downstream demand from our inventories (if we could) or placed orders with our upstream supplier (our forecasts).

As the rounds progressed, the swings in inventory overages and outages became more frequent and more extreme. We each did our best to adjust, but that just seemed to make the volatility worse.

At the end of the exercise, I remember the professor asked a member of each group to go up to the front of the room and draw a chart of the demand curve their team saw during the game. Each group's chart looked wildly different. All were chaotic, and there was no discernible pattern among them.

Then the prof dropped his surprise: You all had the exact same demand from the market throughout the game. In fact, the level of market demand was constant for the first several rounds, increased once, and then stayed at that new level for the rest of the game.

Despite a remarkably simple and stable demand structure, the system spun out of control relatively quickly. With every team.

Of course, that's the point of the exercise: complexity breeds risk. Where there is uncertainty in a system (e.g., when making forecasts about the future), there are both operational and behavioral foibles that must be tightly managed lest they compound to introduce real and non-intuitive instabilities.

The takeaways from the exercise are: simplify processes wherever possible, optimize visibility and communications across the system, align incentives -- and appreciate that even with all these precautions, you'll likely never have a perfect system. So remain vigilant for the emergence of bullwhip volatility in order to reset things before they get out of hand.

The Monetary Supply Chain

All right, so what does this have to do with the Federal Reserve?

Well, the Fed also operates a "forecast-driven distribution channel." It makes forecasts about the health of the U.S. economy and determines how much money should be in supply to best meet its goals for price stability, financial system health, and employment.

With the lessons of the Bullwhip Effect fresh in your mind, you might be wondering: How simple is the system that the Federal Reserve uses to manage the money supply? 

Well, the Fed would like you to think it's as simple as can be. Look at this easy-to-understand schematic:

(Source)

The Fed gives money to banks to then lend to people. Pretty darn straightforward. What could go wrong?

Oops, but wait a minute. It turns out it's a little more complicated than that. If we dig a little deeper, we see that the U.S. Treasury plays a role in "conduiting money" into and out of the system, and that the Fed (via the FOMC) also interacts with corporations, in addition to banks:

(Source)

Hmmm. Okay. So there are a few more folks in the pool than we originally realized. Still, the players all fit nicely onto a single chart. It's probably all very tightly coordinated and finely controlled, right?

But wait; each of those boxes in the above chart is actually a vast organization (or collection of organizations). Let's look at each briefly:

The Federal Reserve

The Fed is actually a confederation of private banks, headed by a board of governors composed of both banking executives and political appointees (not the most efficient or effective of combinations):

(Source)

Treasury

The U.S. Treasury has more than 100,000 employees. Of course, they don't all interface with the Fed, but multiple departments within the Treasury do.

(Source)

Member Banks

More than one third of all U.S. commercial banks are members of the Federal Reserve System. That's thousands of banks. They are managed by the 12 Federal Reserve Banks, each of which has oversight of its district. 
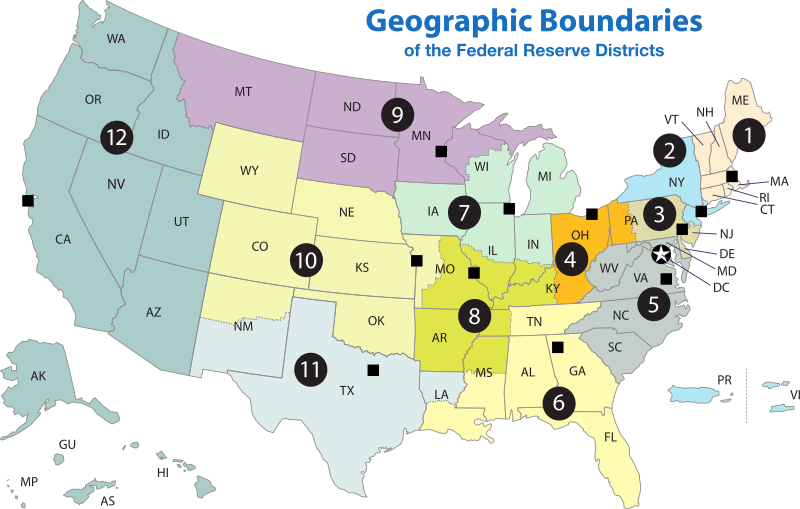
(Source)

Complexity vs. Resiliency

So, the "simple" structure of the Fed providing banks with money actually encompasses the coordination of various departments within the Federal Reserve system, its thousands of member banks, and at least some part of the U.S. Treasury behemoth. Oh, and private corporations, too.

In this context, the near-death experience that the financial system experienced in 2008 due to liquidity issues comes as little surprise. When things begin to get volatile, with this many parties involved, the Bullwhip Effect tells us that those responsible for forecasting are almost guaranteed to be wrong. Especially when additional parties, such as Congress and the Executive Branch, get involved as they do in crises like we saw in 2008.

It doesn't help that even during times of relative stability, the Fed's forecasts are poor at best:

(Source)

As central banks around the world conduct the greatest monetary experiment in human history in real-time around us, it's important to keep the Bullwhip Effect in mind. The mathematical odds that the world's many central planners, with their manifold partners in distributing fiat liquidity, are going to have the finesse to successfully steer their ships to safety through the shoals of inflation and deflation that threaten on either side, are very low. And that's before taking into account the unintended consequences of their more extreme measures.

Bottom line: If another liquidity crisis hits (which Chris is warning may be at our doorstep), the one thing we can count on is that the response from our leaders will be ill fitting to the situation. Prepare accordingly.

~ Adam Taggart

This is a companion discussion topic for the original entry at https://peakprosperity.com/why-the-bullwhip-effect-all-but-guarantees-another-poorly-handled-liquidity-crisis/

Adam - Well done. Nice description for us non economists.
 

(cross posted on the Climate thread)
Just following on Adam’s excellent example of the bullwhip effect on managing the beer distribution system, I’d like to point out the other side of the equation. The example given shows the chaos induced within a complex system from imperfect forecasting of demand signals but the same uncertainty and ramifications exist for supply dynamics too.

I am frequently asked about how climate change is likely to show up in our lives. In the context of the Beer Distribution Game, this would show up in the forecast accuracy for supply availability/costs. For the whole beer distribution process to work you need to have a reasonable expectation of being able to estimate the amount and price of a given product (beer) with some level of precision to ensure a profit margin.  

Climate change messes with the predictability of costs for both production and distribution. There are numerous implicit or explicit models being used that assume climate stability. For example, grain prices are anticipated to be tied closely to the amount of planted acres (hectares) in any given year. There are always some regional droughts and floods to contend with along with localized hail storms, locust swarms etc., but within a global commodity system the premise is that these perturbations will even out over space and time. A heat-wave that decimates Russian wheat could be made up by a bumper crop in Canada, for example, or a down year for global production in 2012 might be made up in 2013 if global grain stocks can take up the slack for a year.

Changing climate though increases the uncertainty implicit in the assumptions of local, regional and global level production. It doesn’t create new problems; it just multiplies the frequency, extent and severity of existing problems. For example, if the likelihood of having back-to-back down years of global production, or having both Canada and Russia experiencing simultaneous crop losses is increasing, and that increase isn’t in the current modeled or assumed probability then the supply chain is going to have problems. Globally, we have gone from so-called thousand year heat events (meaning conditions that you expect to happen by chance once in millennium) happening on 1/1000 (0.1%) of the planet’s surface every year for June-August, which makes sense, to annually experiencing such events at 4-13% of locations between 2006-2011, which makes no sense if climate has not changed (link).

Supply models can and do ignore thousand-year phenomena but they cannot reliably ignore things that happen every decade. Put another way, you can handle extreme uncertainty for 0.1% of your production stream but you cannot have a reliable system that is consistently wrong about overestimating 10% of global production.

Back to the beer distribution example, climate change can induce supply problems that are slow, say water availability for a bottling plant, and manageable, erratic and costly, for example global wheat or barley cops, or serious to catastrophic, like loss of the hops crop in Germany for a year (about 45% of global supply). Throw into the mix periodic inability to navigate the Mississippi due to drought, more frequent supply issues in ports like New Orleans (Katrina) or New York (Sandy), and you can see instability in commodity availability and pricing is likely to increase the chaos inherent in the Bullwhip effect of uncertainty for complex pricing systems in the coming years.

Globally we have run up quite tab already and the bills are going to be coming due in unexpected ways.

Mark

P.S. It is interesting that the schematic of the Federal Reserve shows that the Federal Open Market Committee gets multiple inputs but has absolutely no indicated outputs. It makes one wonder what purpose it serves and how they actually influence the complex monetary system….

Excellent intro to a key topic going forward, Adam, i.e. systemic fragility.  I wonder if there isn't a second-order dynamic in play here: the Fed's forecasts are notoriously inaccurate (what housing bubble?), as are all the other govt forecasts which never anticipate recession.  What sort of faith can markets place in these forecasts? Obviously very little, but the markets seem ever hopeful that the Fed's controls are magically better than its forecasts–meanwhile, the efforts at control and the bogus forecasts are feeding back into each other.
Great commentary, Mark–those 500-year floods and other anomalies happening every 5 years or so add some nice snap to the bullwhip.

Chaos.

I would give it a 10. I am waiting for the dismount though as my determinant, because from the point of the release is where all the trouble begins and OH Boy!, could the fall really be spectacular. I don't fear it so much but I am just terribly anxious for the point where we catch our footing again. Is anything irreparably broken? We shall see.
This Bullwhip thread by Adam has me on high alert and it is painfully clear his thread is as relevant as any thread written even though it didn't get much ink spilled from the commenters. Nice Adam. Just wait until margin calls are demanded to rein in speculation as this perhaps gets the downward rock a really rolling. Will Gold go much lower…We'll see. Who cares, you just gotta have it. Why? Please see Arthurs thread again. Nice Arthur. Corporate earnings are near and forward guidance seems a bit on the negative side, and if I have learned anything, corporate profits returning to the mean will just be plain ugly.

Corporate earnings are near and forward guidance seems a bit on the negative side, and if I have learned anything, corporate profits returning to the mean will just be plain ugly.
I work for a chemical company and for the most part our division is doing well and has been for the last five years.  After we revised our methods for passing through directly the costs of increases and decreases of our primary raw materials to customers (all crude oil derivatives) the company realized stable and predicatable earnings and profits.  Since we are few layers removed from the retail customer those pass-through costs usually are delayed by a few months - further cushioning the downside risks to customers.  So long as we don't see a spike in the oil price from say the current 95-100$/bbl to say 150$/bbl or more I believe we will see the economy hum along happily for awhile yet and corporate earnings will surprise by staying about where they've been for past few years.

I was hoping not to have to spell it out.
Very simple systems lead to chaotic behaviour as illustrated in the very simple double pendulum. Notice how the tip of the pendulum is constrained. It cannot go beyond a certain point. That is because in this system there is only one Strange Attractor. There are other Chaos examples with two or more strange attractors. Here is an example with two.

and here is an attractive visualization of a Strange Attractor operating in 3 Space.

Wiki.

Being a mathematical construct they can inhabit nSpace. Where n is any number.

 Chaos is an important discovery. To me it illustrates yet another Limit to what we can comprehend. Where in Adam's model above is Chaos hiding?

Thus endeth the tale.

I only have visibility at the 30,000 ft level.  There are two types of corporations in the data I have - financial, and nonfinancial.  Red line: Finance companies, Black line: Nonfinance companies.  You can see that the finance companies share of GDP (red line) has just gone nuts the past few decades.  It is absurdly higher than normal - from 1% in 1950 to 5% now.  If we call 2% "normal", then 5% is 150% higher than normal.The other companies, making "real stuff", have a slice of GDP that's definitely higher than normal; right now its 6%, and perhaps throughout history it was around 4.5%.  Perhaps that increase comes because US companies are selling products overseas, outsourcing work, they have low US wage pressures, low interest rates - let's call it 33-50% higher than normal.

absurdly higher than normal - from 1% in 1950 to 5% now.
Thanks for sharing the data and your perspective from the 30,000 ft level as I agree this is really what is fundamentally underpinning the macro economy.  My purpose for sharing my experience at the micro level was meant to convey that things are quite Ok for some - at the moment.  Of course this can change in an instant as we saw in 2008.  Moreover as you point out the absurd financialization of the markets are serious cause for concern.  The chart presents a boringly flat red line for about 50 years then kaboom all hell breaks loose and the banker's party has been raging ever since!  Looking at this chart I would expect a "correction" seems in order for both sectors sometime but the more painful and ugly one will be in the area of finance since they appear to be still a bit bloated and not adding much value to our economy or lives.  

http://www.hussmanfunds.com/weeklyMarketComment.html…take a look see at the analysis of this fine Doctor. A must read every Monday. IMHO
 

Good article - thanks.