Hi guys. I will present my final study of the geolocations of all points of interest. Since my last update I develop a method to convert pixels in a specific footage and covert to line of sights of objects that is possible to identify in the Google earth satellite picture. The method result is a grid-map off medium and maximum deviation of the horizontal position in pixels. The location with minimum maximum or minimum medium tends to be the best geolocation of footage.
The method has its limits because it is necessary to know where the horizon is in the footage so vertical lines can be located on the object to measure the horizontal distance in pixels.
In total I used 13 footages and 43 screen shots.
This study was based on minimizing the error of geolocations. To minimize the error the best reference points are light poles, visible edges of buildings, visible tree trunk, projected edges of buildings, projected trunk of trees.
Geolocation of light poles:
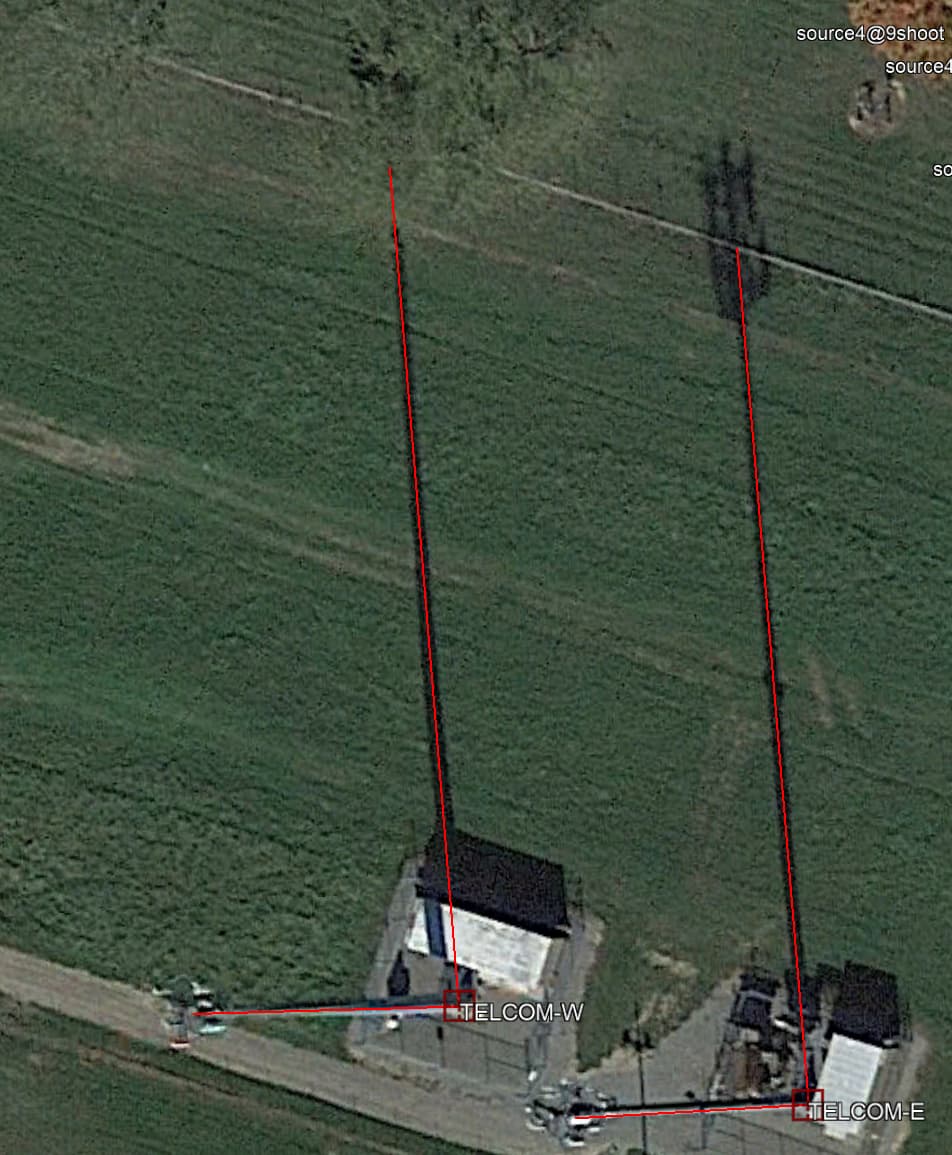
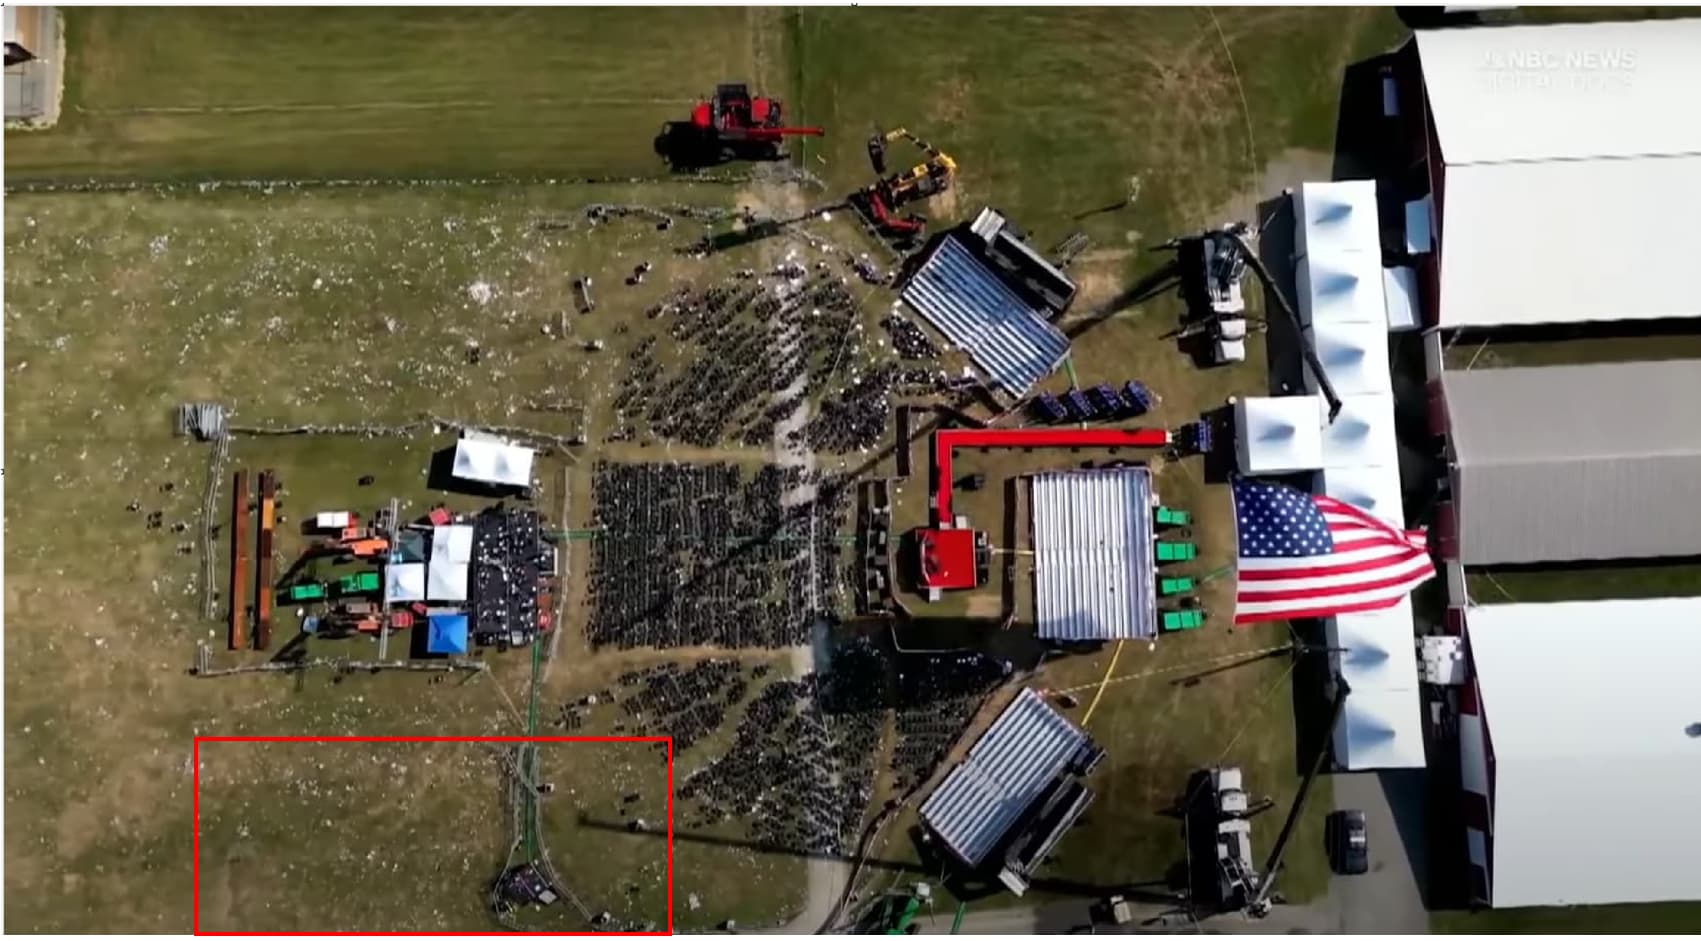
The best way to find the geolocation of light poles is to draw lines of shadow and the light pole, the point where it cross is the geolocation of base of light pole. here is an example of that:
Elevated position correction:
Reference points that are in elevated position must be corrected since the satellite picture is not perfectly vertical, but at angle of around 25 degrees in the case of 11/05/2021. This angle results in altering the geolocation of elevated position to the West, so the correction must be in the opposite direction to the East. For example, the frontal wall building 6 has 3m of elevation that in the satellite picture results in a dislocation of that position 1.4m to West. So, when defining any reference point on that wall the geolocation must be corrected 1.4m to East.
Using a drone footage of that wall I projected that image on Google Earth on the front of the building. So, when I need a geolocation of any point on that wall, I use this image to geolocate.
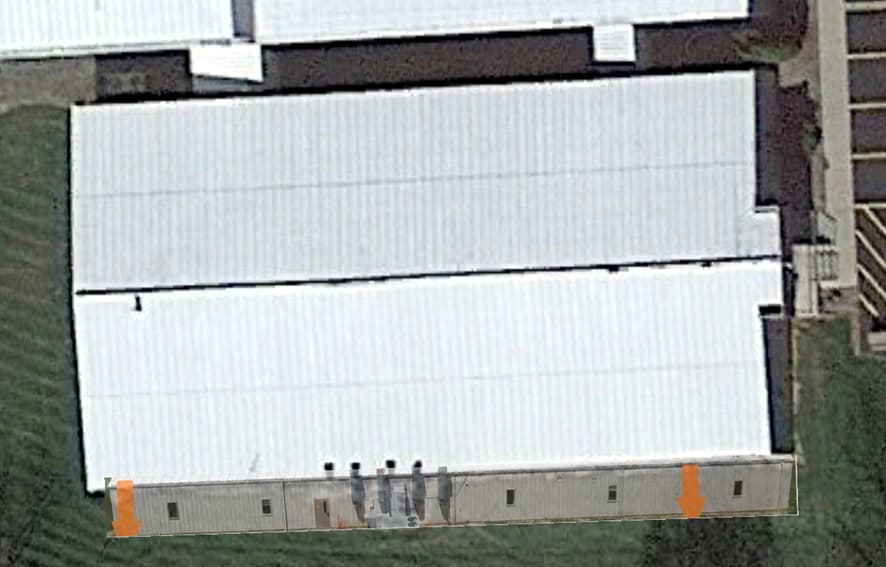
Observe that the West end of the building does not coincide with the roof image, also that difference will occur on any point on that wall.
Now the order of the footages will be important since some of them are more precise than others. The most precise one is RSBN, because the angle of the camera is wide, the footage is close to horizontal, and is Almost a still position. I used 2 methods to geolocated RSBN.
method 1: footage pixel model
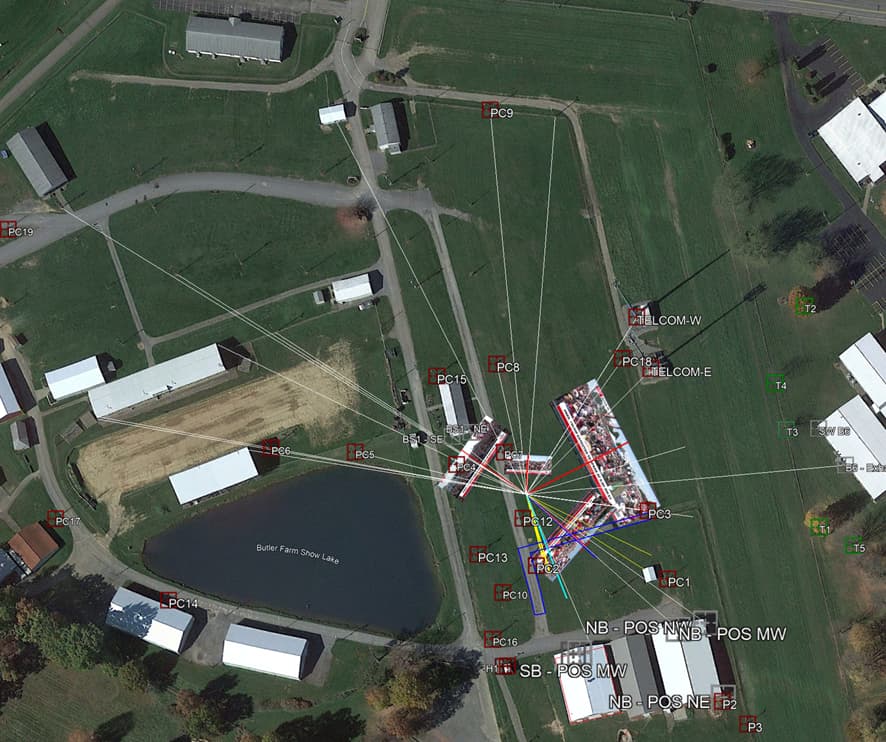
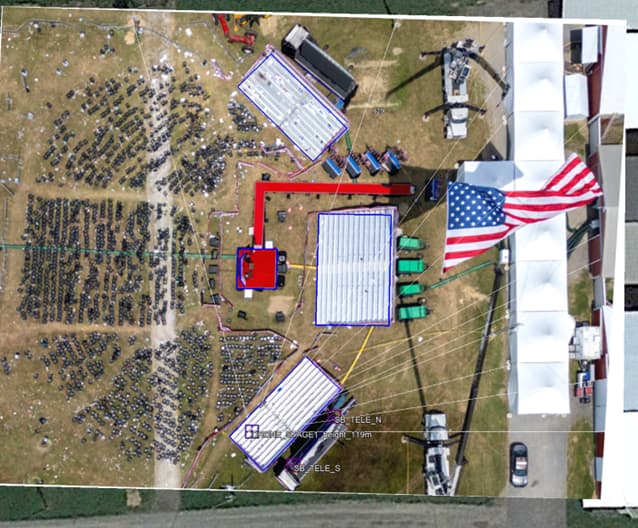
For RSBN I used 5 different print screens of different times that covers different angles. Then I estimate the geolocation of each footage. Here is the map with all the reference points for RSBN.
The resulted geolcation of each image differ in around 2m. So, what I did I find the minimum error between all footages and the best geolocation found was here:
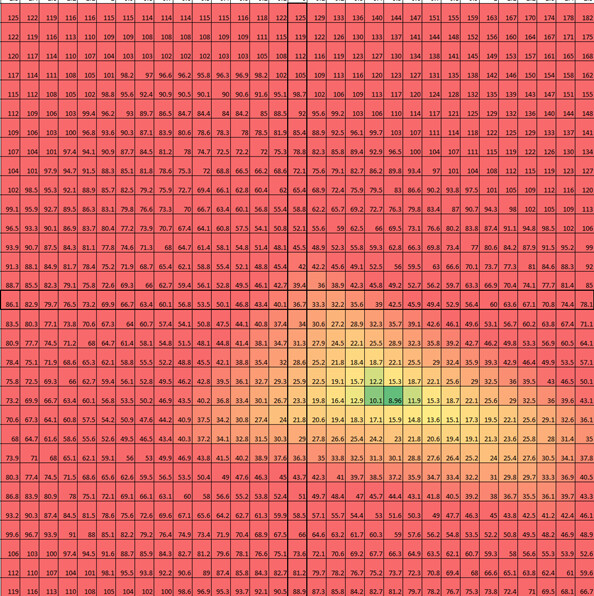
This grid is 3x3m pointed to the North and the middle is a reference point (586684.00; 4523384.00)
Also, I was able to find the angle of the camera without zoom of 70 degrees +/- 0.2 degree.
Result RSBN: 586684.48; 4523383.68
method 2: drone image.
This drone image has a lot of error, to minimize that I found points of references that are close to RSBN.
Drone photo:
Drone photo orientation: North: 40.857441°, East: -79.970249°, South: 40.856761°, West: -79.971883°, Rotation: -23.2355°
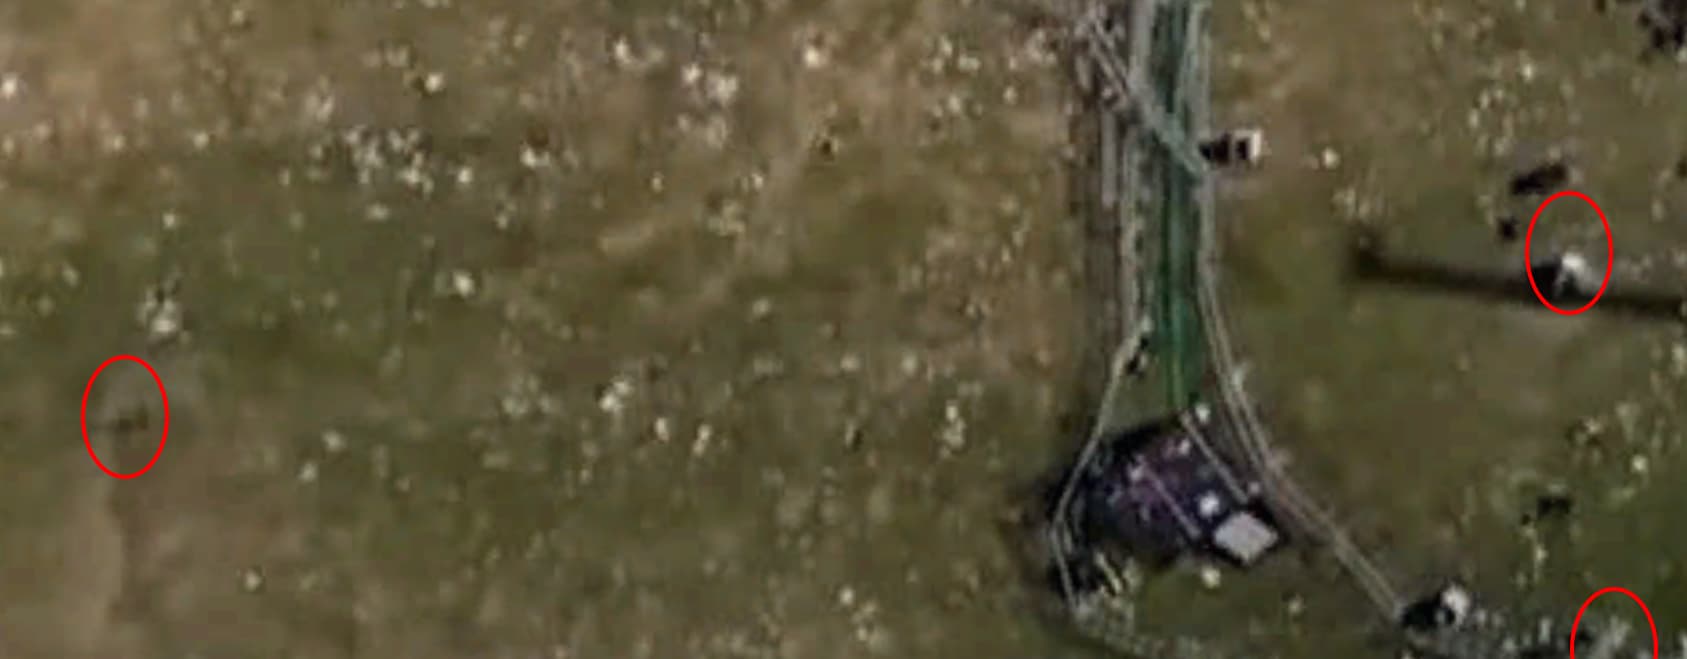
Here are the 3 points of references used on the zoomed image close to RSBN:
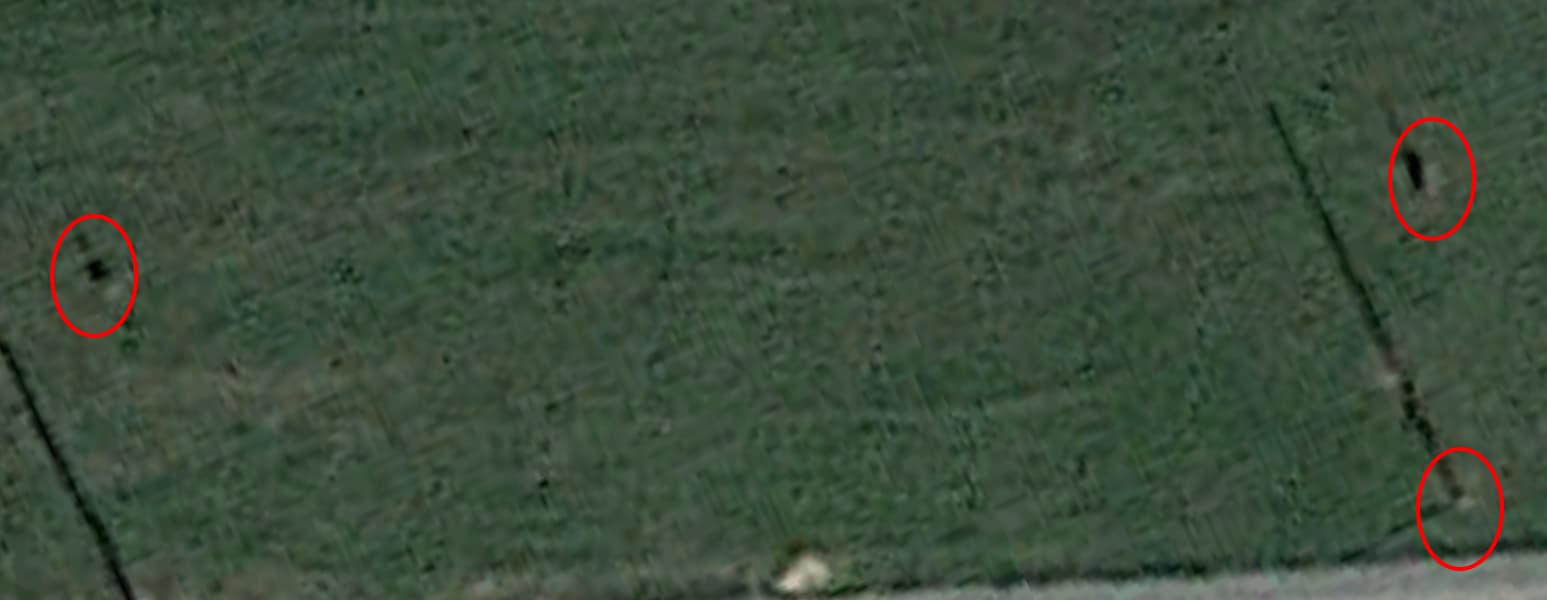
Here are the same points of references used on the satellite picture:
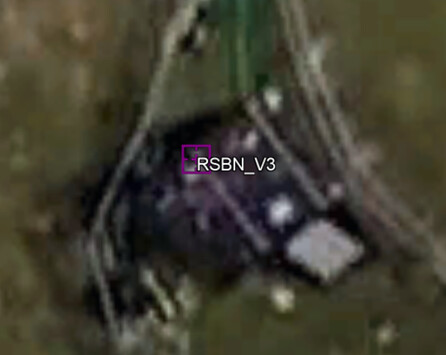
Here is RSBN location (method 1) on the RSBN podium of the drone image.
The error from method 1 and 2 is around 0.3m. Since the method 2 depends on defining where the camera is in the RSBN podium, method 1 is more reliable.
NTD and C3P:
With the line of sight of RSBN on NTD fottage, it reduces the points of tests for NTD locations. The same happens to C3P footage.
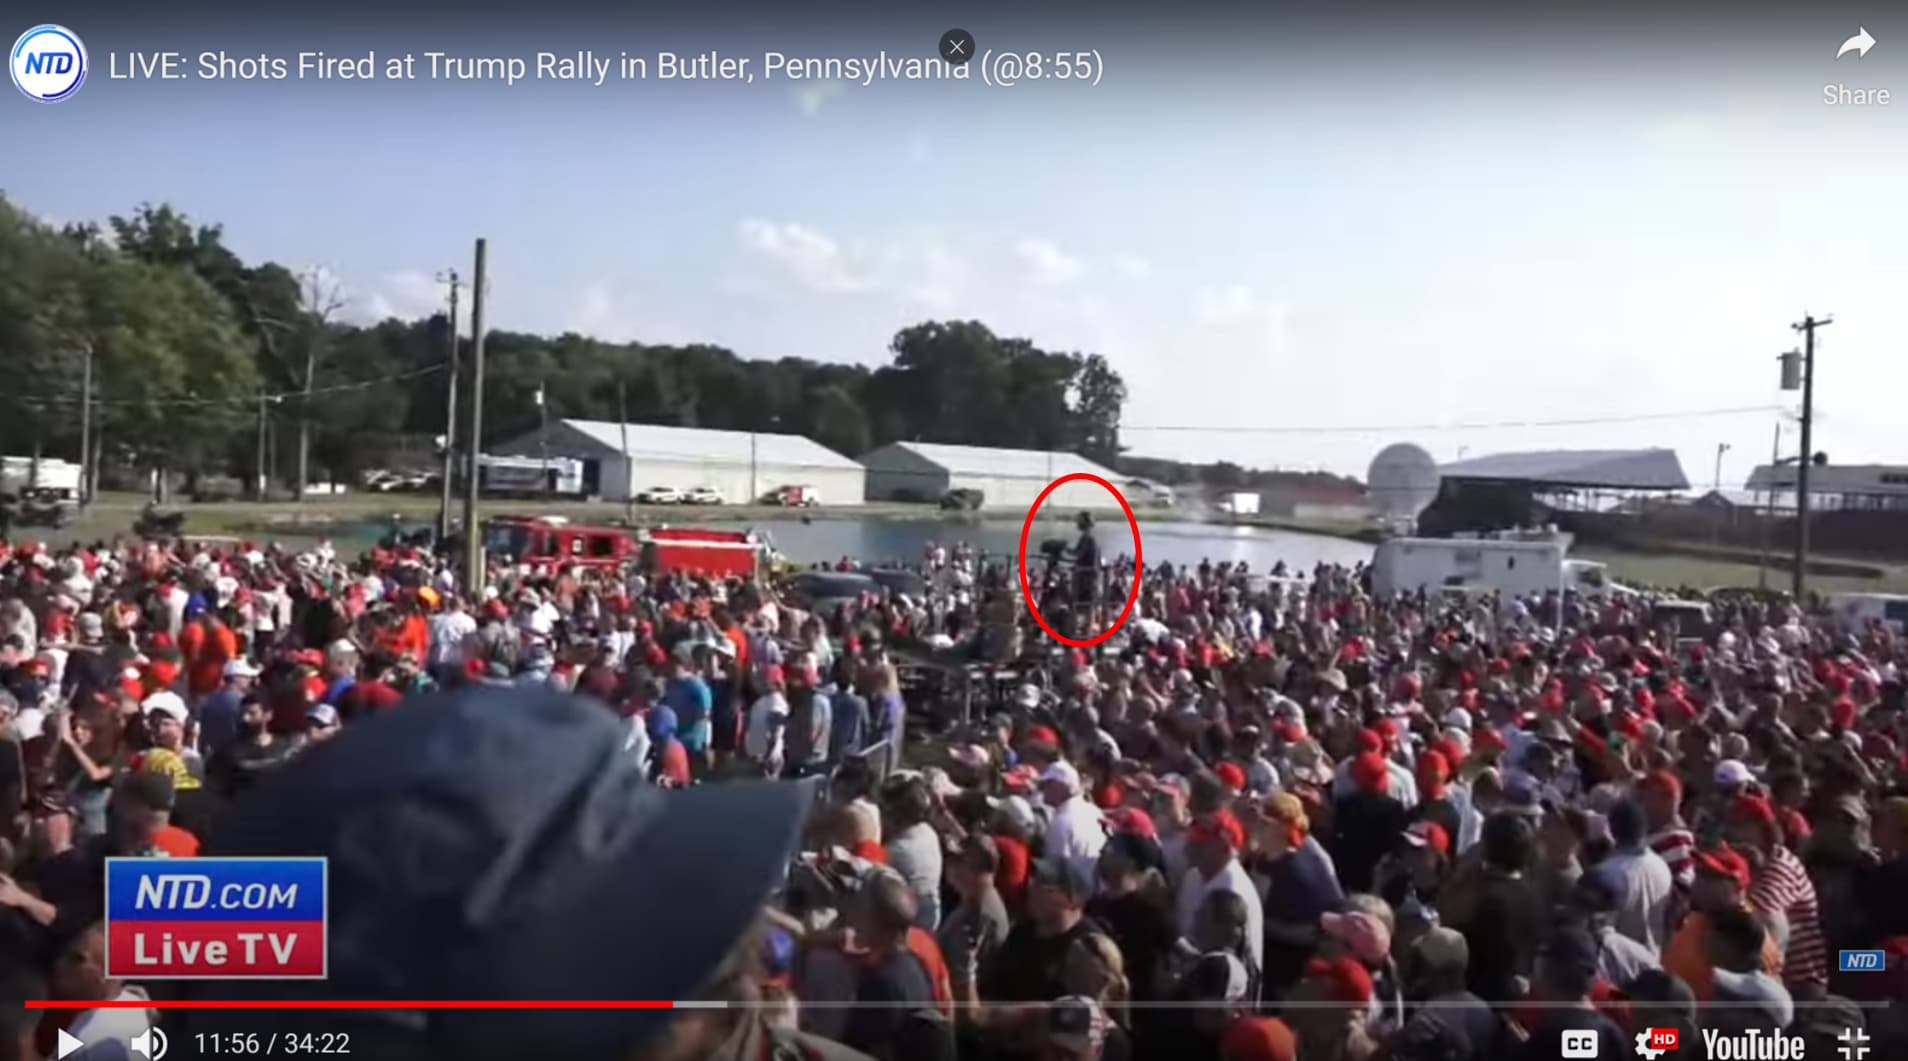
NTD sees RSBN at 11:56:
C3P sees RSBN and possible sees NTD at 1:27.
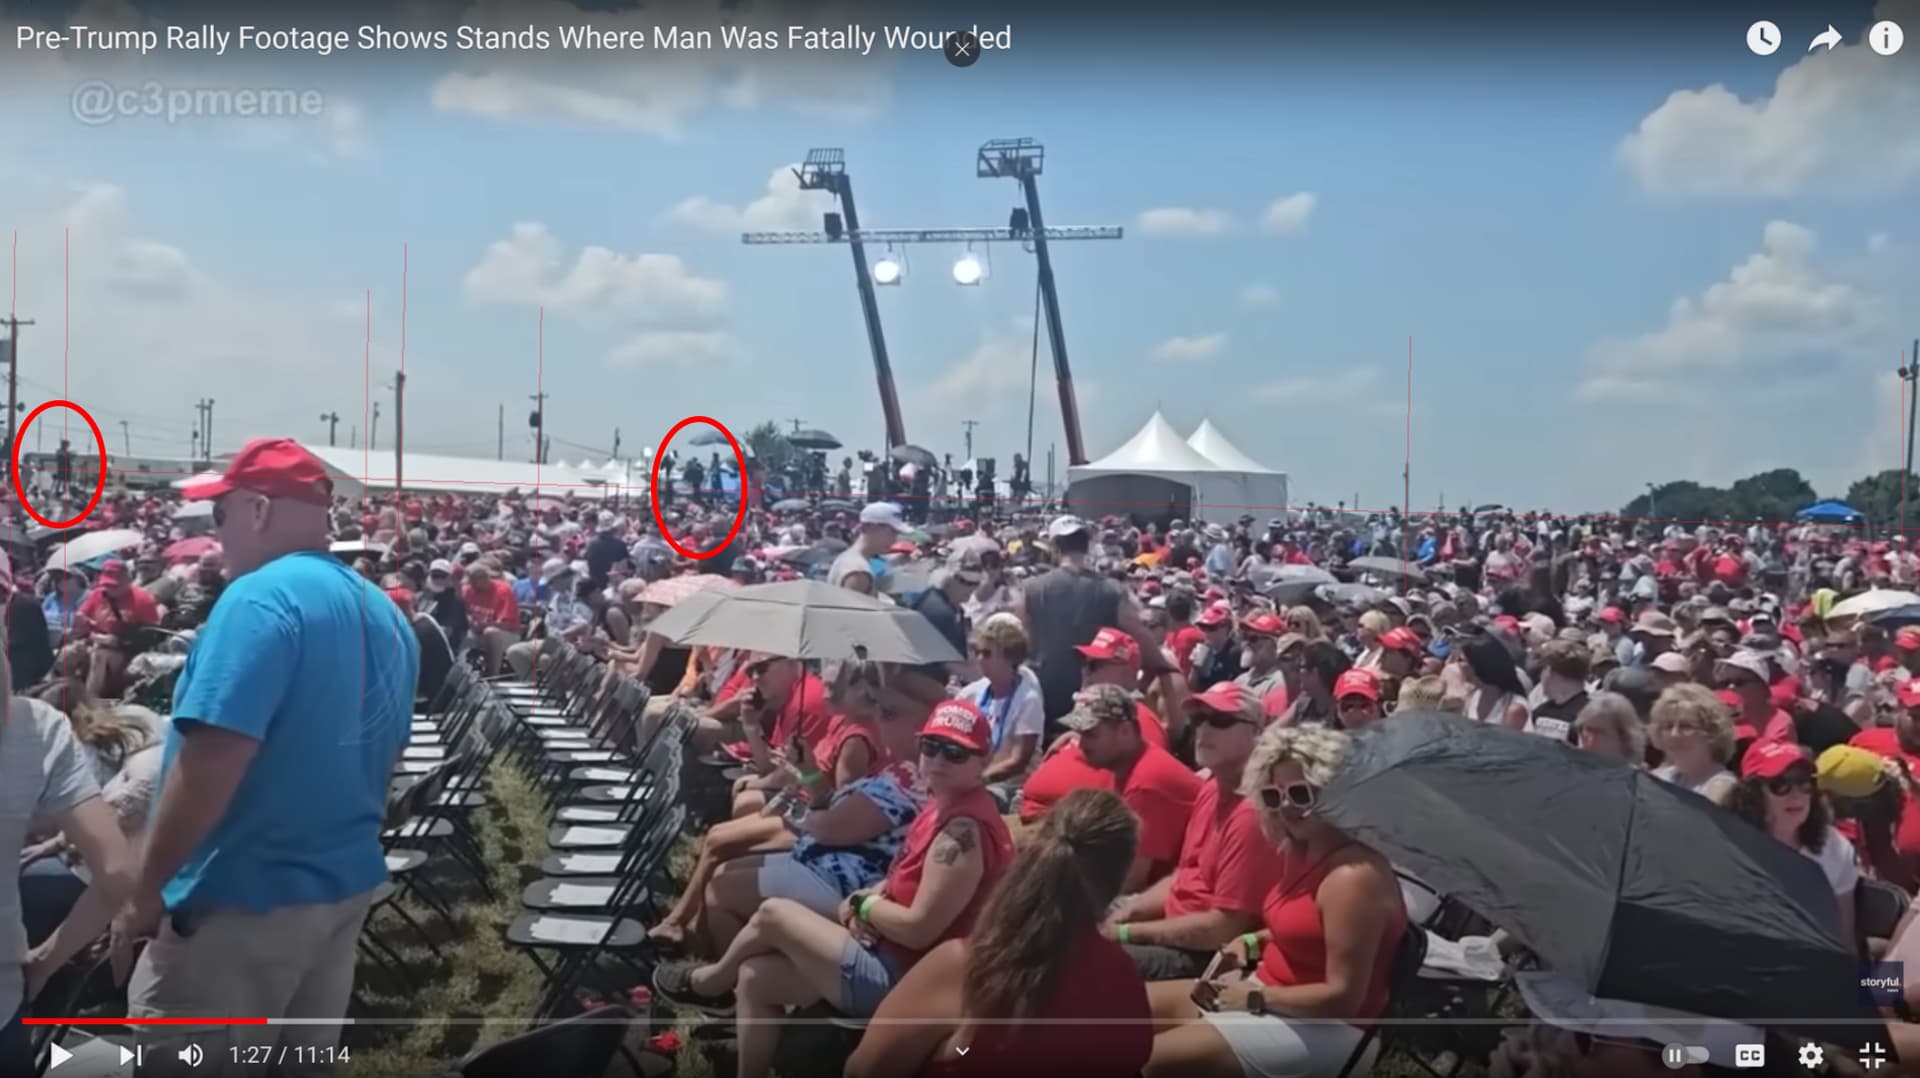
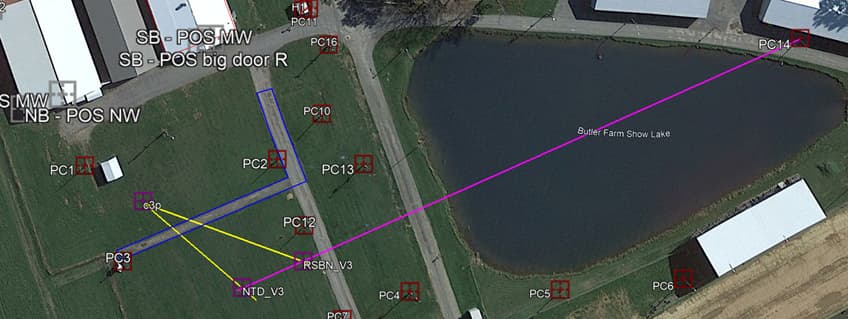
C3P lines of sight of RSBN and NTD in yellow and NTD lines of sight of RSBN in purple.
Also, after having RSBN NTD and C3P I was able to project lines of sight from Trump, James, David, the Bleacher top positions and the Teleprompter positions. This is all done without the drone image from the Trump podium.
The Trump podium top drone photo:
This photo has some distortion that are difficult to overcome. But a manage to use the perspective correction from PowerPoint and achieved some pretty good results.
Here is the perspective correction used on PowerPoint:
Rotation X: 358°; Rotation Y: 19°; Rotation Z: 359° perspective: 20°
And here is the orientation: North: 40.857287°, East: -79.970452°, South: 40.856745°, West: -79.971403°, Rotation: -23.5482°
Here are some the points I was able to identify.
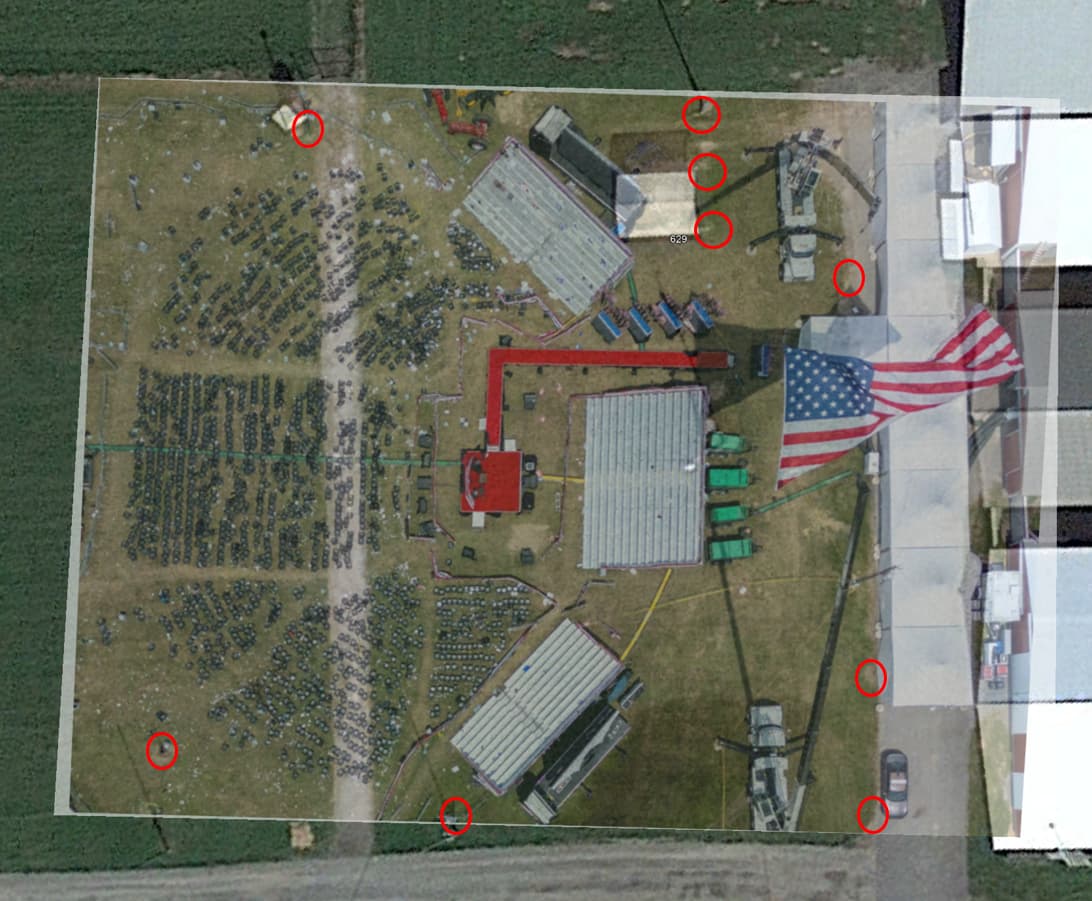
The error was reduced from 1.5m to 0.3m. Now even the Barns are parallel to the satellite image and the level of accuracy is very high been possible to identify small variations on the roads.
Elevated positions corrections:
Now comes the correction of elevated positions on that image. Crossing all possible vertical lines, I found the most probable geolocation of the drone (586719.64; 4523375.42) and its elevation of 119m. Since the white tents have the same height, I was able to estimate corrections of elevated positions. The final result came pretty close the geolocation of bleachers using the footage method 1 with errors of less then 0.3m.
Here is the Bleachers corrected in blue.
The most distorted is the Middle bleacher.
Source 5:
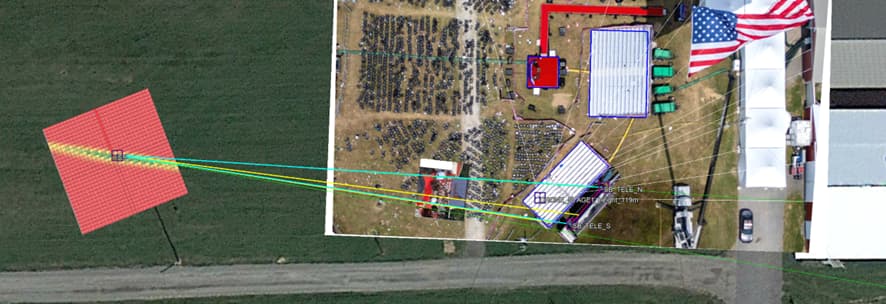
This source is far away from the podium and since it is zoom in (only 5 degrees of angle of view) the geolocation from the pixel method is imprecise and the range can differ 1 meter to side and 5 meters to front and back. Still here is the geolocation (586658.66; 4523405.68) and the grid of error map projected on Google Earth.
James and David positions was checked by RSBN NTD, source 5 and TMX.
With the defined position of James I used James footage to validate his location and Trump location. It differs around 0.2m, but James could have moved to the side on the footage.
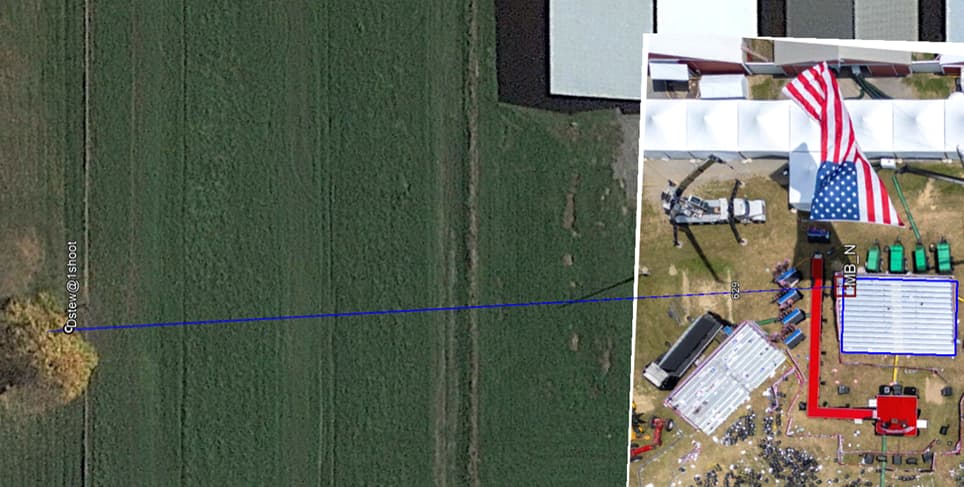
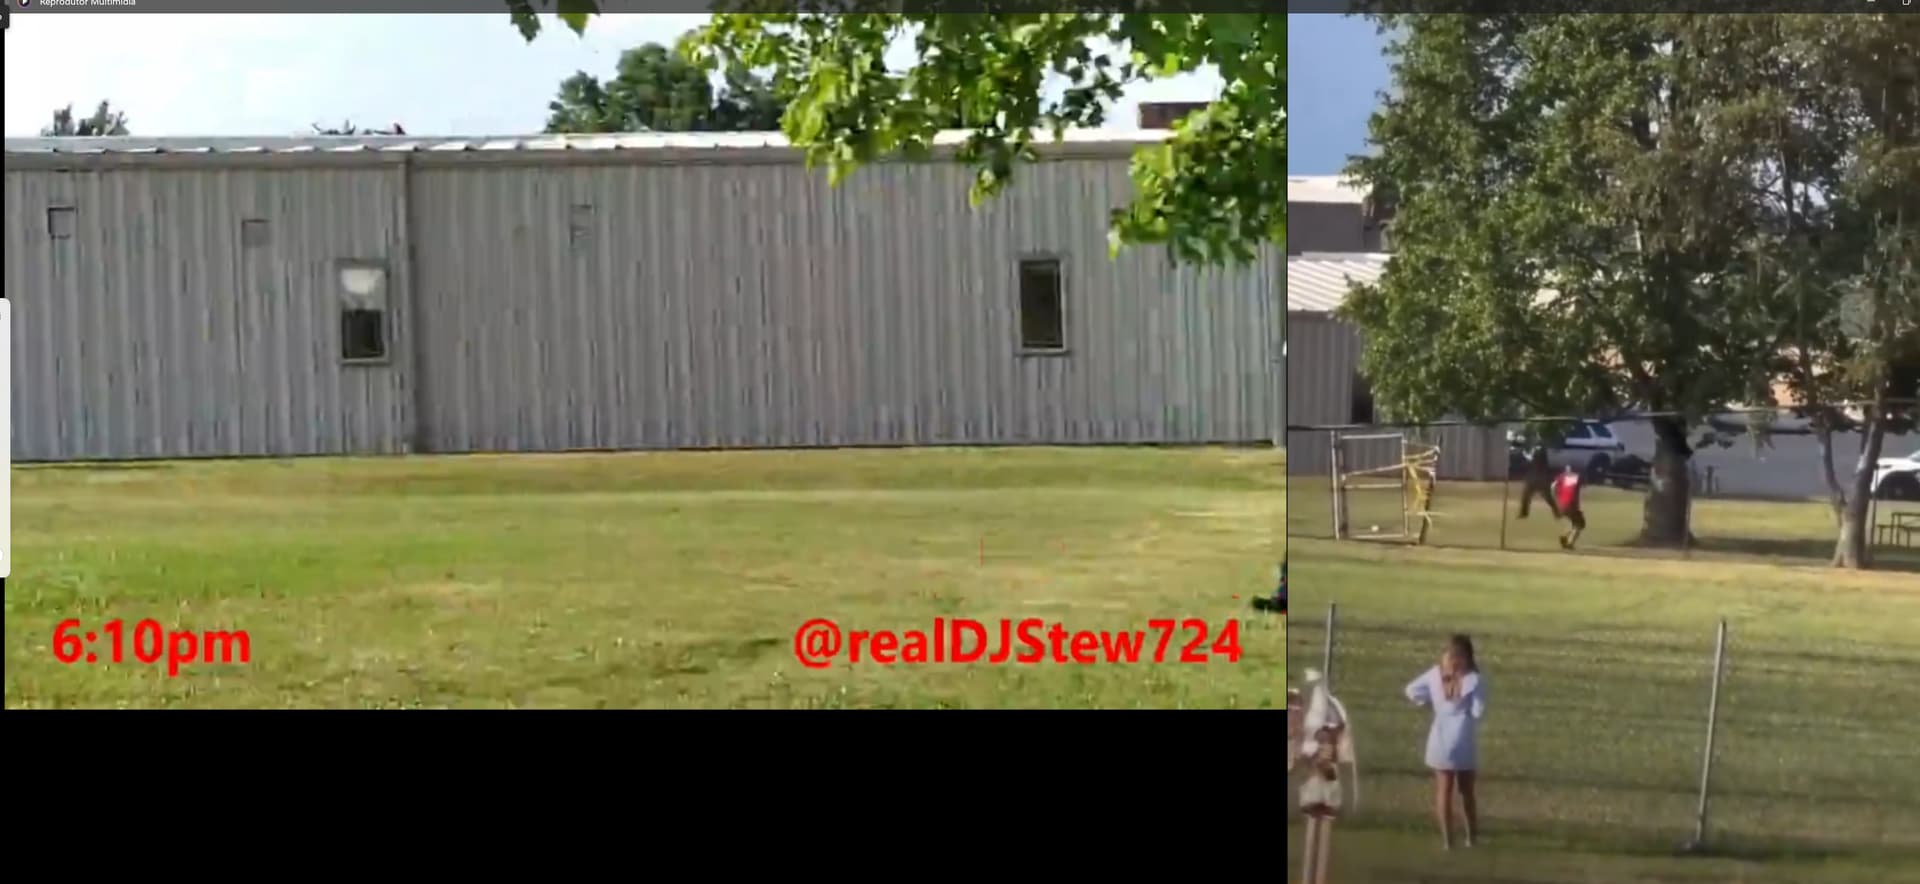
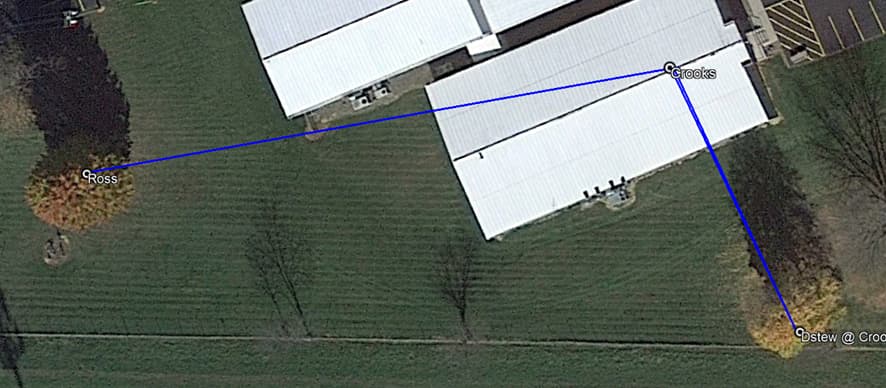
Middle bleacher footage that sees Dstew was synchronized with Dstew footage. This way I was able to identify Dstew line of sight in two times: at 1st shot and at the time Dstew sees Crooks seconds before shooting.
Synchronized footages when Dstew sees Crooks seconds before shooting:
Dstew footage was located during his movement during the shooting using the Middle bleacher footage, his on footage and some line of sights. Also his movement was considered linear during 1 and 4 shots.
The same method was applied to source 4.
Ross location was determined by his on footage and by source 4 seen him near shot 10.
Using Ross footage and Dstew Crooks position was determined by the line of sights from the footages. This was compared to the geolocation of Crooks using post images of the scene and the correction of the roof elevated position the locations differ around 0.2m.
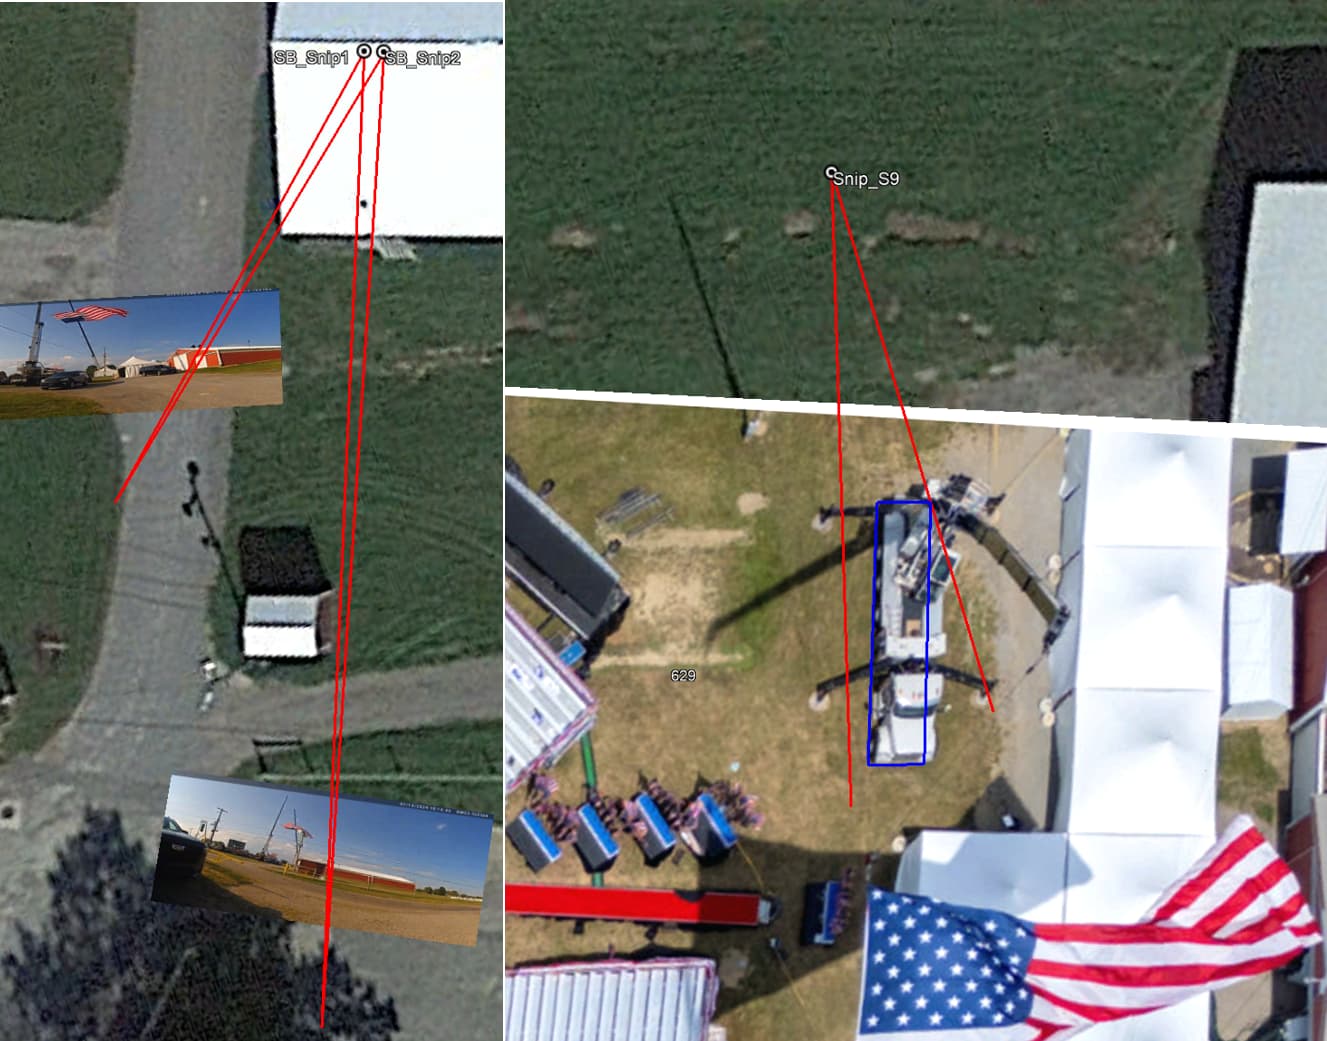
The BWC footages was used to define the South Barn Snipper position by 2 print screens and the 9th shot snipper I used 2 prints also.
Here is the final result for all points of interest:
| ref | E (m) | N (m) |
|---|---|---|
| RSBN_V3 | 586684.48 | 4523383.68 |
| NTD | 586691.16 | 4523403.54 |
| c3p | 586733.45 | 4523409.60 |
| DRONE_STAGE1_height_119m | 586719.64 | 4523375.42 |
| Corey | 586736.21 | 4523417.70 |
| S5 | 586658.66 | 4523405.68 |
| James_v3 | 586722.04 | 4523372.12 |
| David_v3 | 586719.97 | 4523371.22 |
| Trump_v2 | 586726.82 | 4523394.08 |
| Trump_MIC | 586726.64 | 4523394.28 |
| SBlower | 586722.47 | 4523376.15 |
| TMX_v2 | 586740.37 | 4523498.02 |
| MB_N | 586744.48 | 4523394.30 |
| Dstew@1shoot | 586774.15 | 4523486.16 |
| Dstew@2shoot | 586775.89 | 4523486.19 |
| Dstew@3shoot | 586779.50 | 4523486.33 |
| Dstew@4to9shoot_V2 | 586781.91 | 4523486.56 |
| Dstew@10shoot | 586775.11 | 4523488.07 |
| source4@1shoot | 586693.00 | 4523528.92 |
| source4@2shoot | 586691.84 | 4523529.60 |
| source4@3shoot | 586690.60 | 4523530.21 |
| source4@4shoot | 586683.23 | 4523537.98 |
| source4@9shoot | 586682.84 | 4523539.08 |
| source4@10shoot | 586683.83 | 4523544.57 |
| Ross | 586683.91 | 4523542.97 |
| Crooks | 586767.73 | 4523529.40 |
| SB_Snipper 2 | 586763.45 | 4523360.11 |
| SB_Snipper 1 | 586762.39 | 4523360.54 |
| Snipper Shot 9 | 586761.86 | 4523426.72 |
| Cruizer | 586793.39 | 4523525.12 |