Audio Analysis Is Most Consistent Two Shooters At Trump Rally

That’s right. See Dayve’s video.

I did this, if you look at my posts above. When you solve for the position solution, the data is inconsistent (no solution that makes sense) with line-of-sight audio from the first weapon to all of the sources. To put it as simply as I can, TMX and DJStew both indicate that the source of the first three shots was ~20 feet further away than the source of the second five shots, when compared to the stage mic. But this would be impossible assuming all eight shots went in the same general direction from the same general area. Which everyone seems to agree on.

The data IS consistent with the shots 1-3 shooter being concealed in the building roughly underneath Crooks, and the sound for those three shots having to take an indirect path to reach the TMX and DJStew microphones that are off the line of the shot.

1 Like

That was the lady on the horse leaving. Watching that bodycam video closer its easy to see the gallop. She was relatively close to the water tower when shots were fired, so it’s a logical exit route for her.

Edit: The guy pushing this is IN2THINAIR.

He previously pushed the “zip line” escape route of the alleged tower shooter.

https://x.com/In2ThinAir/status/1814313884490018889

240811 t

1 Like

Greg_n

re.*** “I describe the details of my approach in the YouTube video 1 I posted 5 days ago.”***

[my illustrative visual graphic is posted at the end of this comment]

Your indicated youtube video is excellent – it helped me understand how I think about the situation and explain it to others. I have thought more about your comparative audio analysis approach and have some observations.

You reference TDOA - I think I have a basic understanding generically of what TDOA (time-difference-of-arrival) methodology – minus the complex mathematical modeling/calculation approaches used to solve various 2D logistics problems.

For example, TDOA seems to be conceptually at the core of the analysis that Mike Adams and Chris Martenson did to estimate shooter distance from the Trump mic – by comparing sonic crack (SC) and gun-report (GR) time differences – recorded in audio tracks at the Trump mic at the rally podium on July 13th. I apologize in advance to the pros if I am using a term of art incorrectly.

TDOA conceptually also can be at the core of comparative audio signal analysis for two or more sources of signal for the purpose assessing distance and location if you have two (three?) or more signal sources.

From your video it appears that you are doing the latter TDOA at least conceptually - wherein you use and sync (align) audio tracks for the TDOA comparative analysis by using the SC for Shot 1 in the Trump audio track as the reference “zero” time-point – and then align the GR signal for Shot 1 from each of the cell phone audios that you want to compare.

I have recapitulated your method but using a much simpler (for me) visual approach of overlaying for example the Trump mic and Source 4 (referred to by CM as “Video of side bldg NYTimes/YMV)(aka – “westside of BLD#6”). The Source 4 also corresponds to the higher definition video released by Piper Grimley recentlyl (I think) – and discussed by Chris Martenson.

I am not using the Source 5 (TMZ/ “Ross get over here”) video/audio – because of the mic position being roughly orthogonal to (to the side of) the BLD2 second floor south facing windows. And because the signal-peak analysis is more difficult. Just to be clear- this does not mean that I believe there must be line-of-sight to a shooter location to use/get value from audio data analysis.

For my present illustration (see visual graphic below), I also am not using (right now) Source 2 (“He’s got a gun) or Source 6 (David Stewart) for my illustration - for other reasons which we can discuss later.

Below is a visual graphic OVERLAY of Source 1 audio (Trump mic) and Source 4 (cellphone mic – westside of BLD#6) – wherein the Shot 1 GR audio signal for Source 4 is aligned with Shot 1 SC audio from Source 1 (Trump mic). Please note the positions of Source 4 GR signal peaks for Shots 2 and 3 relative to the corresponding positions of Source 1 SC signal peaks for the same Shots 2 and 3.

  • GR signal shifts – from visual overlay it is clear that there is an UP-FIELD (to the left) signal shift for GR signal relative to the SC signal for Shots 1 & 2 respectively. There appears to be a minor (harder to see) DOWN-FIELD (to the right) signal shift for GR relative to the SC signal for Shot 4.
  • Shots 1, 2 & 3 – DO NOT appear to be from the same shooter in view of the clear significant comparative audio signal shifts (aka deltas for TDOA) in the indicated illustration.
  • Shot 4 – also appears to be from a different shooter from Shot 2/Shooter and Shot3/shooter and is a bit less clear regarding Shot 1/shooter because of the limitation of this visual overlay illustration method (I think).
  • I do not want to start explaining the relevance of the indicated UP-FIELD and DOWN-FIELD signal shifts because this type of comparative analysis wherein graphic-audio-spectra are aligned/synced/zeroed around Shot 1 – provides a non-intuitive visual picture and makes the quantitative analysis similarly unnecessarily complex (I think).

The Source 1/Source 4 (TDOA) comparative analysis findings clearly suggest 3 Shooters (I think it shows 4 – but I have the benefit of other better analysis approach and other comparisons).

Note – I think that Source 6 (Stewart) audio is a red-herring (perhaps adjusted by the DS) – to make it look like Shots came from the same source – and is partly why your TDOA got the results that it did. Your inclusion of the Source 6 data set may have obscured/confused the shooter locations.

Also, my sense (for me) when comparing audio tracks immediately quantitatively before a qualitative analysis that gives me a road map - is risky because of my (human) error in making assumptions and specific measurements off of audio track plots.

Critics will say that I am inserting bias - fitting the data, yeah maybe/NOT. I have been groping around in the dark for weeks on this banging my head on the corner of the coffee table – and dropped down many dark rabbit holes that end badly (getting-my-knickers-in-a-twist) – so - yes I will use a qualitative and intuitive approach as “radar” first – to avoid some of the bumps in the road and dead ends . . . .

I think Source 2 comparative analysis confirms and supplements the findings and conclusions regarding a potential 4-shooter hypothesis. I did not use Source 2 for an illustration because I want to get a better-quality Source 2 audio track plot that has a reference time-bar-metric. Using the one I have would just raise questions about relative scaling etc. – that would distract from the message and insight into the relevance of audio signal shifts across multiple soundtrack sources (I think).

Again, I thought your youtube video was excellent.

All the best,

pbd

PS – regarding your other question – regarding the factual predicate and analysis for how I reached a specific 4-shooter hypothesis will have to wait for a different post – this comment is already too long for most.

PPS – to re-emphasize – the visual graphic overlay (shown below) has some preliminary profound qualitative value for illustrating generally a multi-shooter hypothesis – BUT is not good for quantitative and specific analysis of the specific DS strategy and explaining the same – re. the Plot to Assassinate Trump (PTAT) – again I have been down this rabbit hole many times – and (for me) it leads to unnecessary confusion and quantitative false leads potentially.

2 Likes

Speed of sound is calculated as follows:

v = 331.3 m/s x sqrt(1 + T/273.15) x (1 + .0124 x H)
where T = temperature in ºC and H = relative humidity

According to Weather Underground at 5:51 pm:

T = 93ºF or 33.9ºC
H = 34% or 0.34

So v = 352.74 m / s = 1157 fps

The wind speed at that time was 7 mph or 10.3 fps WNW almost perpendicular to the shot direction of SSW. I estimate a -2 fps affect on the speed bringing v = 1155 fps

We don’t need to speculate on the snick-report time. It IS what it IS.

Average loss of speed due to air friction including the wind speed / direction is likely in the 1.7% to 2% over the entire range of 400 to 450 ft for a 55 grain round.

55 grain rounds
Muzzle velocity of 3000 fps x .98 = 2940 fps

d = .2205 / (1/1155 - 1/2940) = 419 ft

With a bullet speed of 3250 fps x .98 = 3185 fps

d = .2205 / (1/1155 - 1/3185) = 400 ft

With a bullet speed of 2800 fps x .98 = 2744 fps

d = .2205 / (1/1155 - 1/2744) = 440 ft

A 77-grain round has somewhat less drag, so the speed could be 2700 fps x .985 = 2660 fps:

d = .2205 / (1/1155 - 1/2660) = 450 ft

Crooks muzzle was 454 ft away.

CONCLUSIONS:

If the rounds were 55 grain bullets then:
THERE WAS A 2nd SHOOTER about 40 feet closer to Trump.

THAT IS EXACTLY THE DISTANCE TO THE FRONT EDGE OF THE BUILDING.

If the rounds were 77 grain bullets then:
Crooks could have been the shooter.

WE NEED TO KNOW WHAT THE BULLETS WERE.
THE FBI KNOWS AND PROBABLY HAS THEM.
WHY ARE THEY HIDING THEM?

IF THE ROUNDS ARE 55 grain, then THERE WAS A 2nd SHOOTER.

P.S. The 2nd and 3rd shots have times of 215ms and 209ms between snick and report. Those would imply correspondingly shorter distances than the ones calculated above by about 2.3% and 5% respectively. That makes it even a further stretch for Crooks to have been the shooter of those rounds.
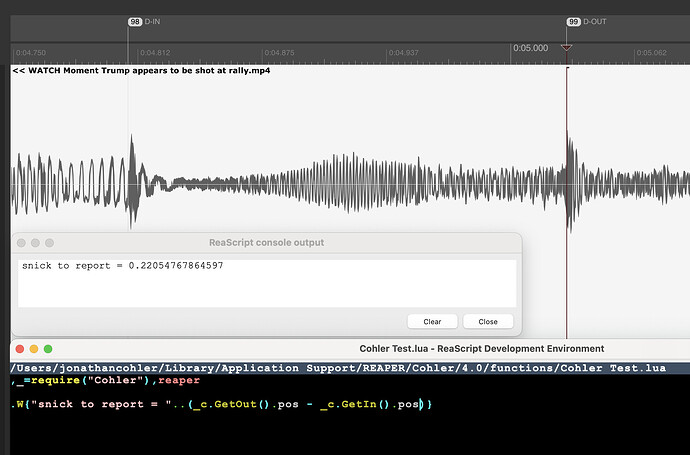
3 Likes

My first question is: How the observers’ clocks were synchronized?
I guess that was based on audio, so when all they can hear exactly the same speach of Trump. If so, that is wrong. Since the propagation delay of sound.
The distance from loudspeakers should be taken into account.

well I mean, people have tried their best. we aren’t government agencies, we don’t have the fancy tools and data they have. everyone is just making their best educated guess.

Nice analysis. I came to the same general conclusion using a 556 with 55 grain bullet, the most commonly sold I’m told. Since a .223 Remington can also be used with an AR-15, did you run calculations for that? I plan to but haven’t yet.

I really hope the bullets don’t come back being cheap 223 ammo. It would explain the minimal damage to Trump’s ear and why he whiffed so badly, but like…really?? You are this 20 year old that figures out this massive blind spot in Secret Service and LEO security detail, and you bring cheap 223 ammo for an assassination??? And this guy went to a shooting club?? That would not make sense to me. 5.56 makes way more sense here, but it’s been a month and they still won’t say what the ammo is.

2 Likes

I don’t disagree with you, and you make a good case for it being a 5.56, but I wasn’t suggesting it was a .223, just that it could be. As you point out, we don’t know what was used so it makes sense that we consider each possibility at this point in time in our analysis.

“Crooks went to a local gun shop that day, where he bought 50 rounds of 5.56 mm ammo.”

2 Likes

Thank you! I somehow missed that article.

thanks

Excellent work. Hope Chris gets to see this amongst all of the noise. It would be great if you could update your initial YouTube video as we might be able to bring to the attention of Chris by sharing it with other YouTube channels.

1 Like

Yes, I’ve been spending a lot of time working on this, and although I think I have a fairly good idea of how the sources were positioned and how they moved I am still seeing some results that don’t seem quite right. At this point, I think it will be wise for me to try using the audio from the police vehicle that pulled up next right in front of the building. It may be too close to the source to provide optimal results, but at least I will know its exact position. I’m going to do my best to produce a video with the new results sometime this evening.

2 Likes

Thank You for your Post.

1 Like

The paper I cited above gave a much higher figure, although sadly they did not specify the bullet mass.

Using an on-line ballistic calculator (with 3200 fps) also gives a much higher figure.

Using a 7% derating puts the available data back into plausible territory, especially given the high margins of error using this technique. If this technique were precise, we would not have a 24-foot spread of outcomes in just 3 samples taken from presumably the same population.

SpeedSpread

1 Like

Excellent! It’s worth pointing out, and strengthening your argument, that in the equation speed*time = distance, the correct interpretation of “speed” is average speed and not initial speed. What happens if instead of 3000 and 3240 ft/s, you go to a ballistic table and estimate the average speed over 150 yards? Your b would then be a bit lower, and implied function d=d(b) a bit higher … closer to Google Earth. (Btw, I got 467 ft from my GE drawing.)

Then the AR-15 would’ve had to have a barrel length of at least 18 inches, since it can be difficult for a 16inch barrel to go above 2800/2900 consistently. It can happen, but the speed usually floats around like 2700-2900ish range from all the tests I’ve seen done on YouTube. also we still don’t know the ammo “brand” he used and how it was loaded. so many variables can affect the speed, especially the speed of each bullet. just because the first bullet is traveling at 2700 FPS, the 2nd one can go 2800, and the 3rd can go back down to 2700 range. especially when we’re talking a cheap 10 year old AR-15 that Crooks apparently had.

1 Like