Audio Analysis Is Most Consistent Two Shooters At Trump Rally

I’m not sure what your issue is. The equation I linked to gives an average velocity range from 2589 to 2638 fps at 454 feet. 2622fps is within that range. If I use your precise figure for speed of sound, instead of a range, it gives 2608fps, which is like 0.5% off from yours. How is that “FAR FAR FAR” outside the range of possibility?

Again, my point: even using your average velocity (which I admitted in my first post would be more precise than mine), that is within the range expected from a 5.56 fired from a 16-inch barrel AR-15.

Then you are talking about something TOTALLY DIFFERENT.

As my post stream began and has repeatedly stated, I am referring to the microphone into which Trump was speaking.

That is 454 ft from the shooter.

The video I used is the MAIN FEED. I included it in my first post. And I showed the 220 ms MEASUREMENT of snik-report difference on the 1st shot.

I think the 1st fire start at 18:11:46 in the camera time on top. The women in white is at red circle.

Look at this reference: Video - Dropbox

image

The policemen react by turning his head at that exact time and hides behind the truck.

1 Like

yes, that could well be, I found a video on rumble that confirms it…

rumble: BWC2-1222104 enhanced body cam video.

Two-Shooter Audio Analysis

In my last post, I dismissed the Cruiser dashcam audio because it recorded the primary response of all eight shot reports essentially identically, even to the point of having echoes from the preceding shots disappeared and “written over.” To further back that up, I will show responses from other, more reliable audio sources so you can see how different the eight shot waveforms truly are. These sources were not totally stationary, BUT, they do appear relatively stationary during the last five shots, and the L/R stereo microphones seems to have extremely similar responses in each case, which says there was probably no “thumb” recorded and these are good recordings. Further, there are large acoustic signature changes between shot group 1 (1-3) and shot group 2 (4-8), in all the recordings that didn’t spend a month in police custody.

For the tl;dr crowd, the resonant spectral peaks of reports 1-3 differ substantially from the resonant spectral peaks of shots 4-8, as well as the spectral distribution generally. By my measurements of first pressure wave arriving from the boom (which I believe to be very accurate), the first shooter was somewhere generally along the shot line of the patsy, but a different gun and a different location.

For those interested in details, first, let’s look at the timing results, and then we can see how we got there. I calculated differential arrival times from the podium arrival times of the booms for source 2 (got a gun), source 3 (TMZ), and source 6 (DStew). I time-aligned these audio sources at shot 4. Why? I had to choose somewhere, and this was a clean choice, and we believe it was likely from Shooter 2 (Patsy) so we know its location. The purple dots in the plot are the podium reference. If all 8 shots came from the same location, and the sources never moved, all we would see are the purple dots as all the sources would have the same time delays and their dots would be occluded by purple dots.

This is almost exactly true for shots 4-8. All sources agree almost perfectly to less than a foot (with two one-foot variations) for these five shots.

For shots 1-3, NONE of the sources agree on the report spacings with the podium. Variations of up to almost 20 feet exist in arrival times (at the speed of sound) from what would be expected from the podium report spacings, if the patsy took all the shots. Note this doesn’t say where the shots were taken from, it just notes the discrepancies.

This COULD be due to the patsy taking the first three shots also, if sources 2 and 6 moved away from the shooter from the time of shot 1 to the time of shot 4, then stopped moving, and source 3 was slightly attracted towards the shooter. But this 18-19 foot delta pattern doesn’t seem that way to me. DStew was moving mostly sideways and not really changing his distance away from Crooks that much. Source 2 couldn’t really move away directly from Crooks, a fence was in the way. Sure, part of this could be them moving some, but not 20 feet. I think the times are reliable, but the microphones had feet until shot 4, so that could be part of the answer.

So now, let’s look at the source 3 TMZ audio to see if we can convince ourselves we have a single firearm. I have cut out and aligned all eight shots in the figure below. I have also noted to the right of each the peak “ring” frequency of the first 15 ms or so of each shot. The first three shots ring at 438-440 Hz, with quite a lot of energy at frequencies lower than that. The last five shots ring at a peak of 485-519 Hz, and have much less energy at lower frequencies. Also look at the red and green vertical lines and note how they hit the first two pressure peaks of the reports for the first three shots, but the second peak is well inside the green line for the last five shots (meaning a higher frequency, probably a shorter gun barrel and/or a different close resonant surface). Lastly, I will note that shot 3 is hard to pick out visually here as there is a high-pitched scream competing with it in the waveform—spectrally they are quite separable.

Anyway, I say this signature means: 1) two different guns (different resonances); 2) two different distances (different spacings from the podium); 3) demonstrates that the dash cam audio with no audio variability is BS.

Now let’s look at the shots aligned for source 2 by the fence. These are hard to align because a) there are loud supersonic cracks/reflections stepping on the beginning portions of booms, and b) they are all different to some extent. The high-frequency squiggles are the cracks—I am not trying to align those. I am trying to align the lower-frequency pressure peaks between the neighboring shots, and I do get perfect agreement with the podium for shots 4-8.

The yellow line passes through the first “boom” pressure peak for each shot (a few of these are hardly visible). The green line passes through the second “boom” pressure peak for the last five shots—basically invisible in shots 4 and 5. The red line passes through the second “boom” pressure peak in shots 1-3—you can see how broad this peak is and how nothing matches it in the last five shots. The blue, purple, and brown lines pass through other pressure peaks used to confirm alignment for shots 4-8.

These alignments are at the msec level—if shifted enough for shots 1-3 to agree with the podium for the one-shooter theory, that is about half the visible graph and nothing aligns with anything. Something is substantially different here between the two shot groups, and it isn’t just the phone moving a few feet.
I won’t show the DStew plots here. The supersonic crack/reflections are LOUD on all of these and stomp all over the boom with a 9 kHz peak that sounds like breaking glass. Underneath that, however, the first three shots have a prominent low-frequency peak at 546, 531, and 528 Hz, respectively. For the last five shots, the low-frequency peak occurs at 376, 351, 367, 360, and 354 Hz. NOT the same gun (unless recorded in a cop car and released three weeks later). BTW, shots 9 and 10 both have extremely low frequencies (highest below 200 Hz).

Also, at Trump’s mike, shots 1-3 peak at 494, 477, and 475 Hz. Shots 4-8 peak at 544, 528, 532, 528, and 532 Hz, with extremely strong second and third harmonics.

To summarize, at four dispersed locations, the signatures of shots 1-3 and 4-8 show two different guns, a stationary firing position for shots 4-8, and a different TBD firing position for shots 1-3.

6 Likes

Hi howdoiknowthisinfo,

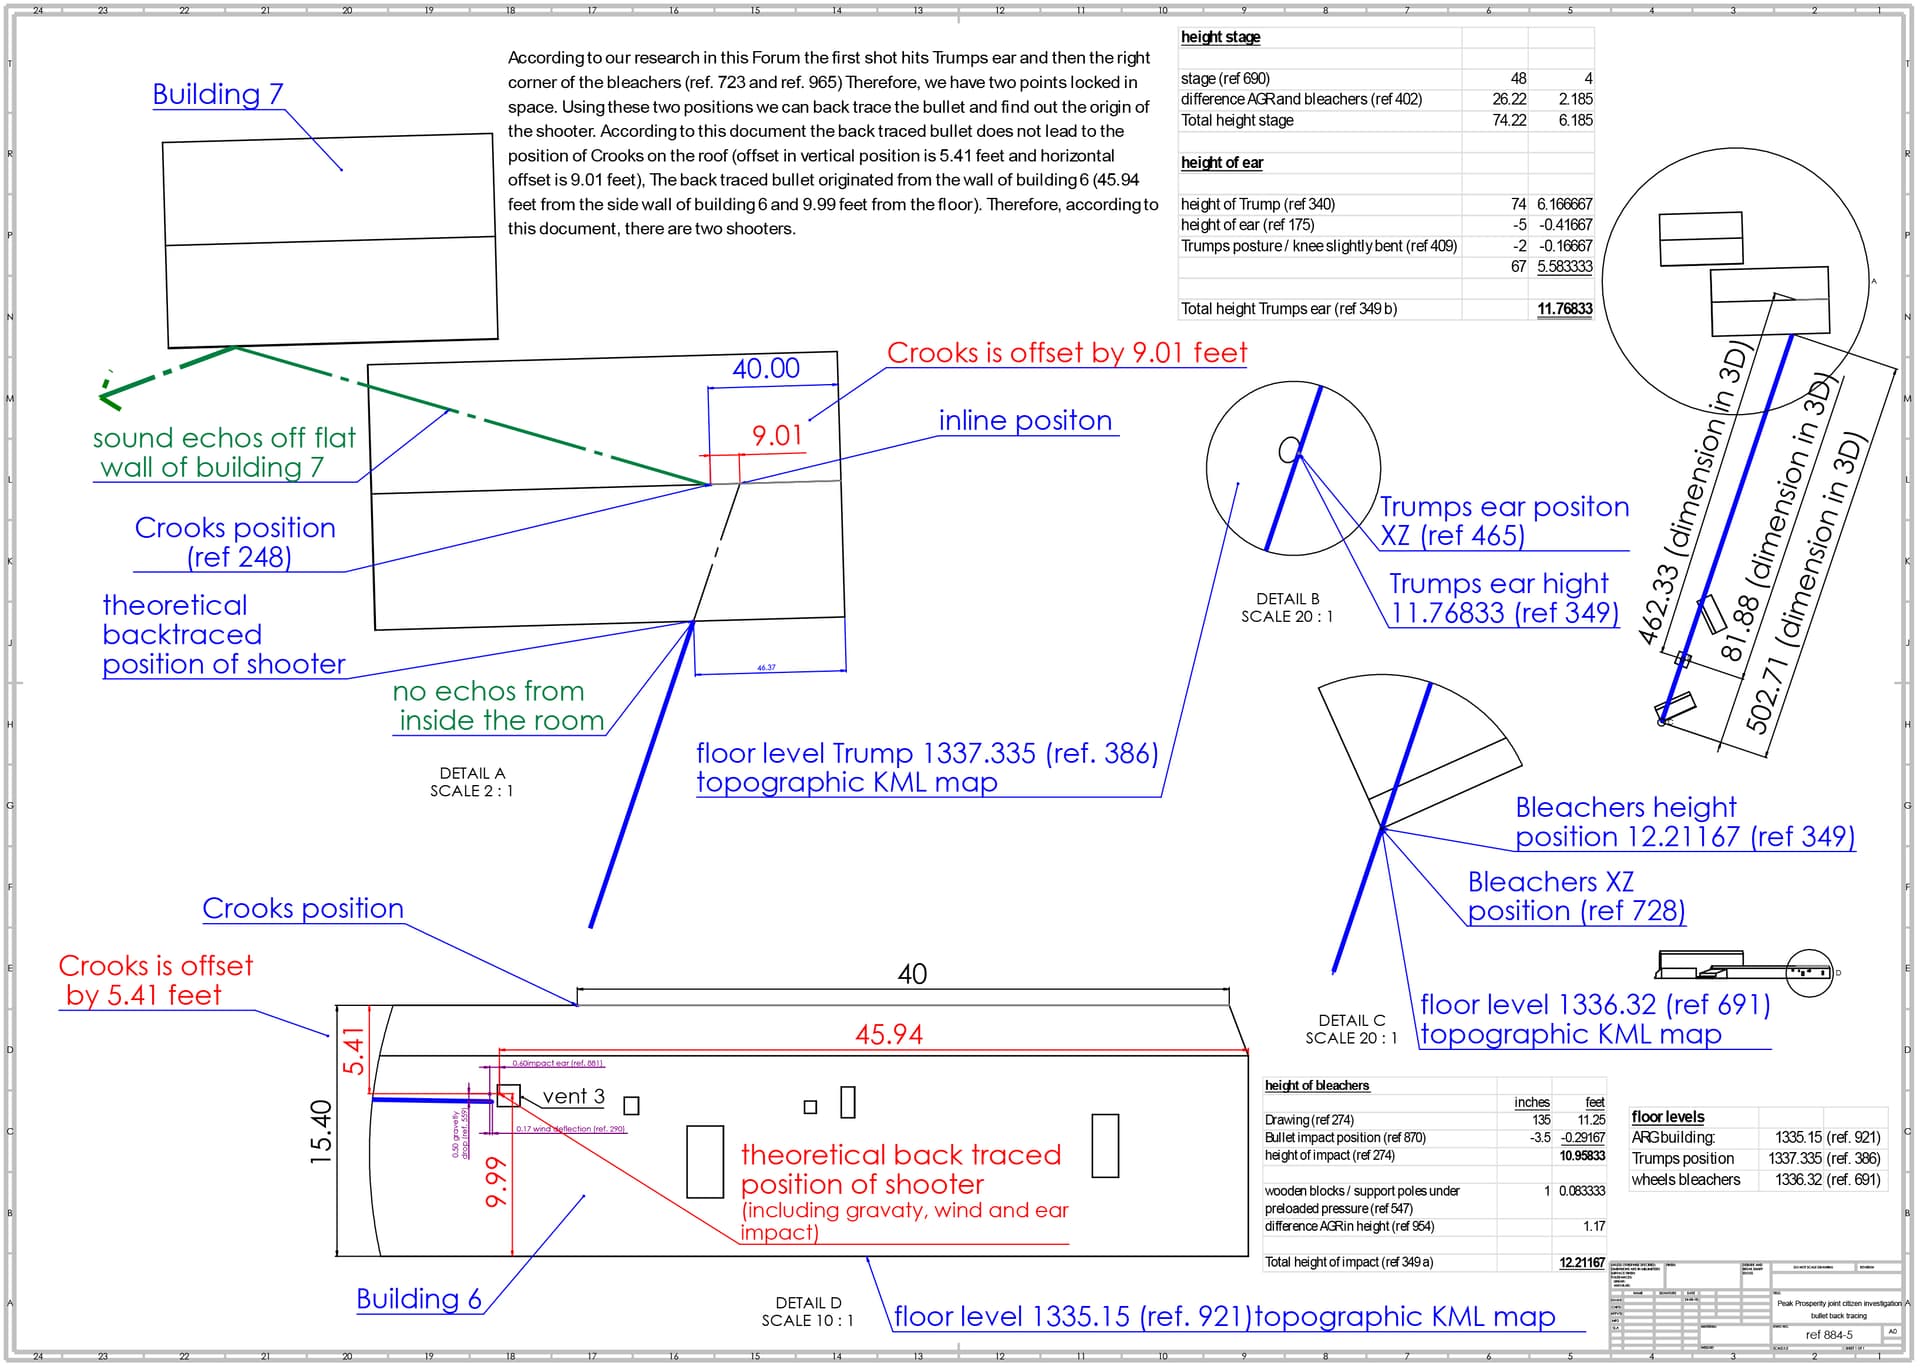
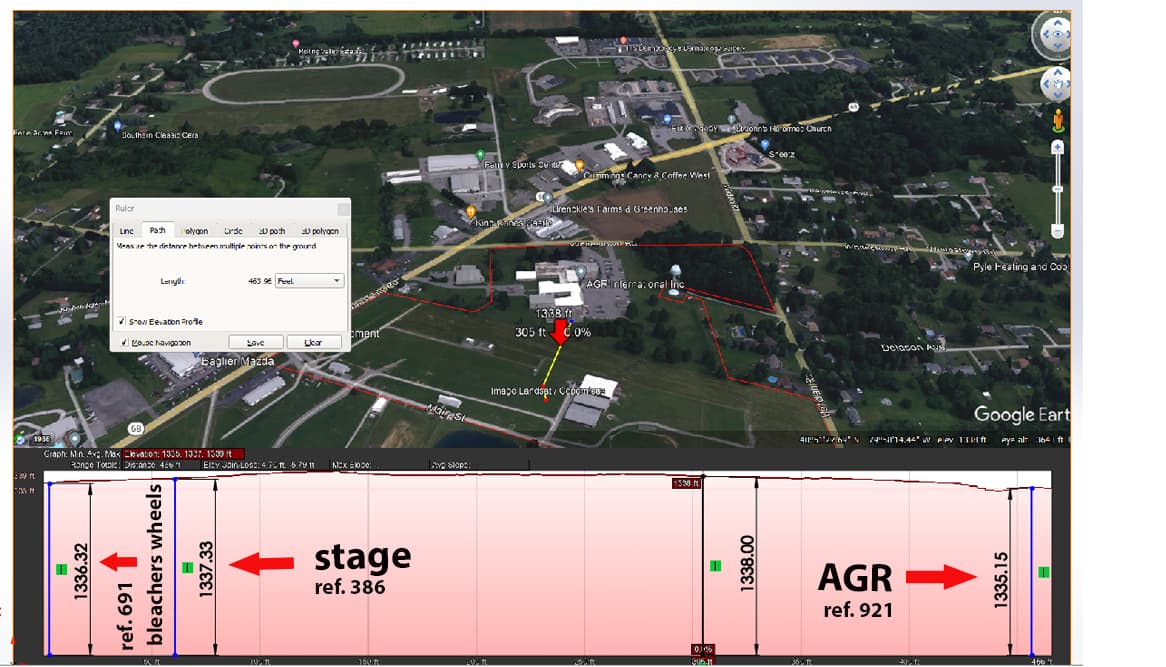
You might have noticed on the drawing below, that we have a reference on each point of interest. All you must do is ask me for the ref. no and I will be glad to provide it to you. So, you want to know the source of the floor levels which are ref 921, ref 386 and ref 691. They have been provided by Land ID in form of a Topographical KML map. See below reference document.

May I ask you which source you are using for your floor levels?

Hi VT,
I put the sequences of the video together showing the first shot and made an animation out of it. Have a look. Strange stuff is happening!

  1. grey paint is covering vent 3
  2. air conditioner deleted
  3. black paint is applied near Crooks head both sides, when he is on the right and later when he is on the left. What are they trying to cover up? Maybe he lifted his riffle, showing that he was not ready to shoot?

Maybe you have an idea what is going on here?

One thing for sure, heavy photo shop applied in this video…

2 Likes

yes, I know that, but what would you be able to deduce given a distance between the microphone in front of Trump at a distance of 775 ft and the snik-report difference of 220 ms?

Hi Roger,
I have been mostly working with the Copenhaver video, and posting in the Copenhaver video thread. I figured one can look at that part of the building that’s directly behind Mr. Trump’s ear from Mr. Copenhaver’s point of view. One then adjusts for the distance between Mr. Copenhaver and the back end of the side railing of the bleachers (about 6 feet to the right and 18 inches up) and adjusts for the change in Mr. Trump’s head position.

What’s crucial is the distance between the bleachers and the podium, and then the distance between the podium and front of building 6. I can’t figure those out from your illustrations. Could you let me know what those numbers are?

Here are the relevant screenshots for reference (the Coperhaver screenshot is rotated 4 degrees counterclockwise):
TrumpCopenhaver004Rotate


James Copenhaver is the leftmost person in the back row of the second photo, he is wearing a white shirt and gray hat. David Dutch is standing two spots to the right, also in the back row. His shirt has red and white stripes on the right shoulder and is blue with white stars on the left shoulder.

Edit to add: I think I figured it out.
Total distance from vent in front of building 6 to corner of south bleachers is 503.18 feet, podium to corner of south bleachers is 82.28 feet, so vent to podium would be 420.85 feet. So the vent-to-podium distance to podium-to-bleachers ratio is 5.11

1 Like

if you have eyes to see, you know the data comes from the google earth tiles.

so, where are the references and evidence that the terrain is as flat as you claim, because when you have eyes to see you can only conclude that AGR building is in a DEPRESSION, i.e., it ground floor level is MUCH lower than the ground level where the SWAT officer is shooting from, and you claim that there is only 2.185 ft = 66.6 cm…

apart from this being a very remarkable number, it is MUCH too LOW.

when I blacken out the area below the ground floor level of the location where Trump had his podium, which was 13440.40 ft = 409.77m, I get the following view in google earth:

in your picture labeled 884-5 you mention that the top of AGR building 6 is 15.4 ft from the floor.

I know that google earth reports 1357.10 ft = 413.64m as the height of AGR building 6 as all the areas that get blackened out at that level include parts of that building’s roof top.

to avoid discussion, I blackened out a level that still keeps a part of the roof visible such that you can confirm that it is that roof at that level:

so, when we subtract the height of that building 15.4 ft, we get at a floor level for building 6 at 1341.7 ft

this leads us to:

  • ground floor level of AGR building 6 based on google earth data = 1341.70 ft = 413.64m
  • ground floor level of Trump’s podium based on google earth data = 1344.40 ft = 409.77m

difference between these ground floor levels = 2.70 ft = 82.296cm.

so, the difference between your and google earth’s floor levels of Trump’s podium and the floor level of AGR building 6 is about 0.515 ft = 15.70 cm.
that is not too bad as an offset, so we agree on the differences between the floor levels of Trump’s podium and the floor level of AGR building 6.

what we do not agree on is the actual values, because they simply do not match anyone’s observations when validating your scheme with what we see in google earth:

the ground level of AGR building 6 cannot easily be established due to the parking (which is not level) and the number of steps in front of that building, but the ground level of Trump’s podium can be easily established, and google earth reports it at 1344.40 ft = 409.77m

you specify this value to be 1337.335 ft, which is 7.065 ft = 2.153m LOWER than what google earth reports. that sort of differences is no longer due to rounding errors…

so, the question becomes: show me whatever actual documentation you use to come to the 1337.335 ft level of the location where you put Trump’s podium…

and referring to a document which is not accessible to me is not something which is trustworthy…

for everything I have been saying, I have given you supporting images, video and explanations.

so, show me the evidence that Trump’s podium was put at 1337.335 ft and that it is not the level 1344.4 ft as reported by google earth…

an image of which I cannot determine the provenance or which I cannot verify or reconstruct otherwise is not a reference document…

I need the tangible input and be able to reconstruct that elevation profile which you have annotated in this picture before it can be considered anything else than an allegation…

until you provide me with this evidence, the floor levels you are using and stating in your 884-5 are about 7 ft = 2.15m TOO LOW!

By your posts here, there is nothing humble about you. You take offense about any criticism of you, but have no problem criticizing others.

1 Like

Does this information align with Chris’s echo data? Do you suspect the muzzle was poked through the vent, or behind (inside) the vent? If you believe your back tracing is correct how do you (we) prove the shots came from there?

Your question doesn’t make sense.

But if you had a microphone that was 775 ft from the shooter muzzle, and there was a snik-report difference on that microphone of 220 ms, and the average velocity of the bullet was 2622 fps from shooter to point of closest approach to the mic, then the bullet would be approximately 173 feet away from the microphone at point of closest approach.

So if you are talking about Trump’s mic, this is NOT possible. Because the bullet was only 1.07 feet awat from mic at closest approach.

so, what would the average velocity of the bullet have to be in order to have that difference of 220ms if the shooter was 775 ft away from the microphone?

I have not yet done sound analyses, hence my crippled terminology, but I am getting to that analysis after the ballistic trajectories that I am adding to my kml files…

1715 fps

from your username we can deduce you are involved in law enforcement or the military.

in either case, it would not surprise you that facts and the corroboration of information is very important before we can come to whatever conclusion.

the first time I was shown the 3d model, I found it odd that the floor levels that were mentioned were all round values in foot, and that these values did not match what I observed when checking google earth. I am open to accepting that google earth is not a perfect reference, but the difference that I observe is a non-negligible 7 ft = 2.1 meters…

so, that is how it all started: I started asking where that vertical offset came from…

now, just less than 2 weeks later, roger adjusted version 5 of the 3D model with higher precision floor level values, which reduce the uncertainty and increase the precision of the model from 30 cm (1 ft) uncertainty to 0.01 ft, which is a great improvement, and as you may have noticed, this updated version allows me to confirm that the vertical difference between the ground floor level of AGR building 6 and the ground floor level of Trump’s podium is more or less negligible: the difference between these two ground levels in roger’s model and in my model is about half a foot, and that is fine by me.

so, the only thing we still are not clear on is the overall vertical offset, and this is very important, because the values that roger is using are 7 ft = 2.1 meters lower than what you would get from google earth… that is much more than a rounding error…

I am simply trying to recreate the 3D model in google earth, and this fails due to discrepancies…

you can call this whatever you want, but if the model that is used to evaluate possible shooter locations cannot be verified and does not seem to match reality, I think there is something wrong with that model.

you call this criticizing, but it is nothing more or less than an attempt to check whether the model is valid or not, and I think you cannot disagree with the necessity that claims are underpinned with unambiguously solid evidence.

every time I ask for the elevation data, I get the same reply: we are using the topographic KML map from Land ID.
I have no access to this “topographic KML map from Land ID”, which means that (1) I cannot validate whether these values are plausible, and (2) I cannot confirm that roger is using this map correctly…

in some posts there was a link to a google drive file called “Trump Rally Butler 2024_.kml” which is supposed to be a precise representation of the rally area, well, I checked that file, and it contains 44 points with longitude and latitude values without altitude/elevation values, so that file cannot have been used to deduce the elevations of either the AGR building(s) or Trump’s podium or the bleachers either.

I prefer a direct approach to avoid ambiguity, so I ask direct questions.
you may see that as inappropriate, but that is not how I see it, I just want clarity about things and if people avoid answering simple and direct questions, that is highly suspicious.

as you may have noticed, it took about a week before I got the answer to the very simple question about the angle between the line of sight from the roof top of AGR building 6 and the podium.
in a 3D CAD program, it takes seconds to visualize that angle, yet he stalled me for about a week.
I would be surprised if you would take that for granted…

and instead of being open minded and encouraging different the analysis of views while analyzing this ballistics puzzle, he tries to steer everybody into the vent direction which is not the most realistic one if you ask me…

based on the very valuable feedback you have given with several of your posts, I can deduce that you have plenty of gun knowledge and expertise, so let me ask you an open question, based on all the information that you have seen passing by and your expertise and knowledge: what is the most likely scenario for what happened during that day before, during and shortly after the assassination attempt in regard to the actor or actors that shot at that rally?

as a matter of reference the first version I saw of the 3D model (this model is very imprecise and does not allow any corroboration whatsoever):

yesterday’s version of roger’s 3D model includes much more detail which almost enables its validation (which implies that it is still impossible to confirm that it is a valid representation of reality):

thanks!

I will feed my ballistics trajectory model with bullet speeds starting from 1600 fps and up and see where we get…

thanks again!

So, your heights reference is Google Earth, by simply pointing with the mouse? Are you serious?

So, if you point to the roof of the ARG building 6, you will get the height of the top of the roof, right? But we need the height of the floor, not the height of the roof!

I suggest you quickly go back and take my suggested crash course which I posted here on August 6:

Once you have leaned that, then you can go to the next level, by importing the Land ID KML file into Google Earth, then finally you will start getting the same numbers I am using as a reference.

I don’t want to pick a fight, but I must mention it again:

  1. The fact that you are using the poked hydraulic hose (which is the third impact point, Trumps ear 1, bleachers 2, hose 3) as your reference point

  2. The fact that the bleachers and trumps ear are approximately the same height (in absolute) makes the bullet trace almost horizontal, like I mentioned in my first post to you, your back traced shot will never make it to the height of the roof you are referring to

  3. The fact that you simply click on the heights with Google Earth, using the most primitive way

Leads me to say, that your knowledge is insufficient to make such “back – tracing” calculations. Therefore, your usernames question is justified:

howdoyouknowthisinfo? of which I would answer, you don’t…

1 Like

what is the url for this data?