The crisis explained in one chart: Debt-to-GDP

If I was ever given just one chart, just one piece of data, to make the case that we were on an unsustainable path that had a date with a long period of contraction and economic hardship, it would be this one.

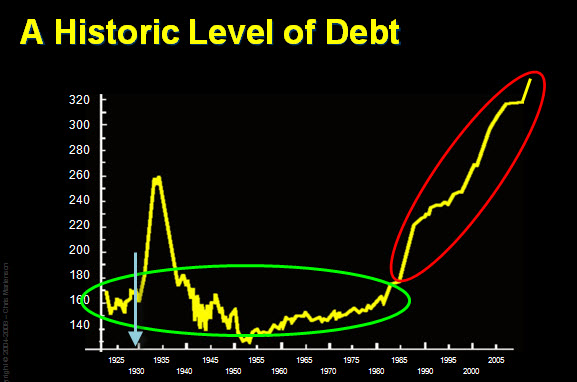
Figure 1: This chart compares total debt (or “credit”) in the U.S. to GDP (or Gross Domestic Product) on a percentage basis. Current total credit-market debt stands at more than 340 percent of total GDP.

As we can see on this chart, the last time debts got even remotely close to current levels was back in the early 1930s, and that bears a bit of explanation. The debt-to-GDP ratio back then didn’t start to climb until after 1929 (blue arrow), because debts remained relatively fixed in size, while it was the GDP that fell away from under the debts. With the exception of the Great Depression anomaly, our country always held less than 200 percent of our GDP in debt (green circle). In 1985 we violated that barrier and have never looked back.

What does this chart tell me? It says that what each of us knows to be “just how the economy works” is really a historically unusual experiment with debt that is barely 25 years old. In the sweep of economic history, this barely qualifies as a blink.

It says, if you listen carefully enough, that all of our global economic growth has been fictitious. An illusion of debt.

Consider that debt had most recently been growing at a rate six times faster than the underlying GDP and you’ll begin to appreciate just how bogus the recent “growth” really was.

Here's an example. Consider two families living side by side. Each is earning $50,000/year. At our first “GDP snapshot” of these two families, we find that each has a GDP of $50k. But the next year one of the families goes out and buys an additional $50k of goods and services for itself, using a combination of auto loans, credit cards, student loans, and a home equity line of credit (HELOC).

At our second “GDP snapshot” one family is still mired in a $50k GDP but the other has undergone an exciting 100% growth in their economy and is now sporting a GDP of $100k.

But the underlying reality is that each family still has $50k of earning power. The measurement itself introduced a fallacy by neglecting to factor out the use of credit when measuring “growth.” That is exactly analogous to the US GDP situation and explains why the US, and much of the world, is now in for a very painful adjustment process.

Debt-to-GDP for family #2 assures that they will be living under the strain of paying down those loans for years to come. Time spent living beyond one’s means necessitates a future period of living below one’s means.

And this is why “unlocking the credit markets” is pure fiction.

Nothing needs to be unlocked. What we need is to recognize the vast damage that we did to ourselves as we elevated and then clung to a set of falsehoods.

The interesting part, as is always true of every bubble, is looking back and wondering how it is that we ever believed these falsehoods.

  • It never made sense that one country could consume wildly beyond its production forever.
  • One cannot borrow and consume one’s way to greater prosperity.
  • It is not possible for an economy to be 80% service based, at least not sustainably.

A point I made in the Crash Course chapter on debt, which was that assets are variable but debts are fixed, can be broadened to include the claim that incomes are variable but debts are fixed.

That same spike in debt-to-GDP that weighed down the US during the Great Depression is now set to vault to some new stratospheric record of possibly 500% or 600% or more.

And the choices for reversing this ratio to a manageable level, notwithstanding Paulson’s confusing alphabet soup array of government bailout programs, are quite limited.

  1. Pay the debts down
  2. Default on them
  3. Inflate them away

That’s it. Those are all the options. All you have to do is decide which is the most likely outcome, and position your life and investments accordingly.

This is a companion discussion topic for the original entry at https://peakprosperity.com/the-crisis-explained-in-one-chart-debt-to-gdp-2/

Looks like choice # 3 is "Our Leaders" chosen course… Brilliant!

I guess we’ll just have to "hunker-down" and prepare for the worst as this Ponzi scheme plays out… it’s not like they (the Pols and Banksters) will listen to reason, or US for that matter (remember how well they listened to We The People as they passed TARP?).

Simple, easy to understand presentation… great work Chris!

Chris wrote:

Here's an example. Consider two families living side by side. Each is earning $50,000/year. At our first “GDP snapshot” of these two families we find that each has a GDP of $50k. But the next year one of the families goes out and buys an additional $50k of goods and services for itself using a combination of auto loans, credit cards, student loans, and a home equity line of credit (HELOC).
Would it be safe to say: Family one fudged their earnings, with fuzzy math, by 40% using imputations, and a funky deflator and therefore really takes home $20,000.00? Of course, to make up for the $30,000.00 shortfall they scan money in their basement and print it on their laser color printer.

Let me get this straight.

Option 1, pay them down. It seems like do this the US would have to renegotiate them, as the US currently borrows to pay the interest, there is no way (especially given the direction of the US GDP this year and next etc) that the USA could even service the debt without renegotiating which is pretty close to defaulting on them, at least that is how the creditors would feel. So option one seems like a lot like a soft option 2.

Option 2, default on them. When I try to imagine that happening, even in the renegotiate version of doing that, it seems like that would really make the dollar toast. No one would want it and anyone with it would try to get rid of it, as it would be losing value. Which makes me think defaulting would pretty much look like option 3, but with a little more honesty about what the USA was doing, probably better option for the world economy if the US can’t get its creditors to renegotiate the terms.

Option 3, inflate it away. The dollar loses value, no one wants dollars, the USA actually has to produce something to get a hard currency (gold?) to buy things in the "global" economy like oil or cheap chinese consumer goods. The US tries to print its way out of the problem, hyperinflation, etc.

Chris, these don’t seem like much of a set options (they pretty much all amount to the same thing). Is there a black swan option out there that no one has thought of yet? Is there a global crisis that might shift the effect of these options so that their outcome is not so dire, in the short term, for the US dollar. Thanks,


Isn’t one of the concepts in the Crash Course the link between the need for exponential growth in the economy and rise of debt?

In that case what was the situation prior to 1985 and the expansion of debt? Hasn’t the pursuit of growth been with us for much longer than that?

I guess there’s another ingredient that I’m overlooking, but I’m not sure what…

This chart seems to explain or reflect the difference between the experience of my parents and me. My father worked intelligently and dilengently during the green circled area and was able to support the family on a single income, enjoy prosperity, pay off debt, and save significantly for retirement and childrens’ college funds. I’ve spent my working life in the red circle so far and, though I’m a reasonably well paid professional and a frugal yankee, I’ve seen my debt grow and my savings shrink and have little hope to receive Social Security in the future.

"The debt-to-GDP ratio back then didn’t start to climb until after 1929 (blue arrow), because debts remained relatively fixed in size, while it was the GDP that fell away from under the debts."

And what happens when GDP plummets out from under rising debt this time? You can’t have 10%+ unemployment without a concomitant decrease in production. Even if most of the jobs lost are in the service sector (like mine was), they still ostensibly produced something of value.


Yesterday, I inquired specifically about this very chart (not necessarily anticipating it would appear today) on the Subscribers Only section. I believe that you are right in using this is the one single chart that "explains" everything. However, my question, still unanswered and even more pertinent today, was expressed as follows:

" The relationship between Total Credit and GDP puzzles me. I have seen this curve where Total Credit to GDP rises from about 150% of GDP (circa 1960) to 360% of GDP in 2007. I have no doubt that Credit has exploded. However, it is the mechanics of such a relationship that are troubling. if I interpret this correctly, even back in the old days of 1960, if GDP rose by $1,000 then Credit rose by $1,500. It just doesn’t seem plausible to me that $1.50 in debt growth only produced a $1.00 in GDP growth. Or put differently, if you received a salary increase of $10,000 that year and you behaved as an "average" person, you increased your debt by $15,000. Recently, the data would suggest that a $10,000 increase would produce a $36,000 increase in debt. What am I missing?"

I agree that the chart is key to why things got so messed up. But, I have difficulty believing that, historically, a $1 of credit expansion never, ever produced a $1 of GDP expansion. What am I missing?

Well, I keep coming back to those last few chapters of the Crash Course, where I saw quite clearly that we cannot continue to grow as we have, using the finite resource base of the planet to sustain us in the ways that we have. Everything that we’ve been doing for the past hundred years, the duration of the oil boom, has been based upon a virtual cornucopia of surplus energy and resources, which are no longer going to be available in limitless quantities. It’s clear to me that this "run-up" is directly proportional to that resource spike, and that what we’ve had since 1985 or so is an economy designed for such an impossible world beginning to accomodate a dawning new reality.

It hasn’t worked. Pouring more of the "same ole" into the battle has resulted in the emergence of a worldwide crisis in all markets and all things monetary. The basis, the bedrock itself, has been revealed porous and crumbling. What path appears most likely other than a rather fast collapse, and what happens during and after that? These are the questions I am wrestling with.


So what happened in 1985 and the next couple years that caused the chart to rise so dramatically during that time?


If I understand the concepts that are presented then I’d have to say that yes - the pursuit of growth has been around much longer than that. If you go back to the chapter on exponential growth, he talks about how even a small percentage every year eventually leads to an exponential graph. However, this is also affected by outside political and economic issues.
Why 1985? My personal opinion is that it was really the first time that the effects of Richard Nixon removing the gold backing of dollars in 1971 was felt. Throughout the 1970s was a period of stagflation which culminated in Paul Volcker at the Federal Reserve raising interest rates drastically in the late 70s and early 80s. The change in the rate of increase of the debt corresponds with the US economy emerging from the recession of the early 80s. I could be wrong about this and I’d love to hear somebody elses explanation.

Chris, Erik and Others…


Isn’t an equally important question to understand and answer is comparing the rising Debt-to-GDP of USA to other World Nations changes in their Debt-to-GDP?


If someone has data on how this is evolving, seems critical in the future of the dollar, inflation, deflation, etc.


If I’m missing something or this is not relevent, please explain.


Thanks,


Nichoman

Would defaulting on the debts to the FRB not be a possibility? That money was made ‘out of thin air’ anyway, so no real damage wil be done. Serious question!
i think defaulting on foreign countries will be seen as an act of war, because the amounts are too large.
Inflating them away has been the strategy from the start. If not done too fast you can get away with it.

Not sure this isn’t an intended effect, but FYI … the chart does not appear to be visible until you register and log in. At least, I couldn’t see the chart until I logged in to post that I couldn’t see the chart … now I can.


This is exactly the same question I have.

Also, does anyone know or have an estimate as to what the "real" GDP is, and what the ratio of real GDP to govt debt is right now?

I have a different theory…

Once the oil shock was over and oil became very cheap again, technological innovations flooded the market with ‘new improved’ gadgets. This was the start of colour TVs, fuel injected cars, computers, mobile phones, air conditioning… the list is long. Everyone ‘wanted’ one of the new gadgets, and year after year, they got better abd better, flashier, with more buttons, and so the old ones became garbage faster and faster. Oh, and I forgot the innovation of credit cards.

This frenzied consumerism could only be fed with debt. And credit cards are absolutely responsible for fuelling this frenzy, because they don’t ‘feel’ like you’re borrowing… repaying doesn’t even enter one’ mind whilst the buzz of retail therapy pumps adrenalin through your veins!

Then I guess it just became a habit.

There’s another scenario Chris M doesn’t mention: cancel all debts. After all, they can NEVER be repaid…

Mike

Hi Nichoman,

Good question regarding other countries and how they are faring. I did a little research and found the following chart from the Government of Canada:

http://www.fin.gc.ca/afr-rfa/2008/afr2008_1-eng.asp#Federal

It’s a good deal better than the US situation at about 30% of GDP.

PS: That’s why the idea of the "amero" is only catchy for americans - Canadians have little interest in buying into that plan. See the following quote from our Finance Minister:

"A North American common currency would undoubtedly mean for Canada the adoption of the U.S. dollar and U.S. monetary policy. Canada would have to give up its control of domestic inflation and interest rates." Chase, Steven (2007-11-22), "Consider a continental currency: Jarislowsky", The Globe and Mail, retrieved on 28 November 2007

see post #7

Hi Damnthematrix,

Your "another scenario" is actually much more plausible than most people realize - Well not exactly just wiping the debt out, but stopping payments and usually following by severely "renegotiating" the debt - It’s called a debt moratorium and has been exercised by countries such as Peru, Brazil, Mexico, Russia, Argentina and guess who? Yup, the US, during the last Depression.

It’s based on the old saying "If you owe a little, the bank owns you. If you owe a lot, you own the bank.".

Sounds more likely doesn’t it?

On a side note, once you know you’re going bankrupt you might as well live big. Citi needs another 10 billion? What the heck, give them 20… :wink:

Default by annihilation, obliteration or otherwise destruction of all of the lenders is one of black swan options.