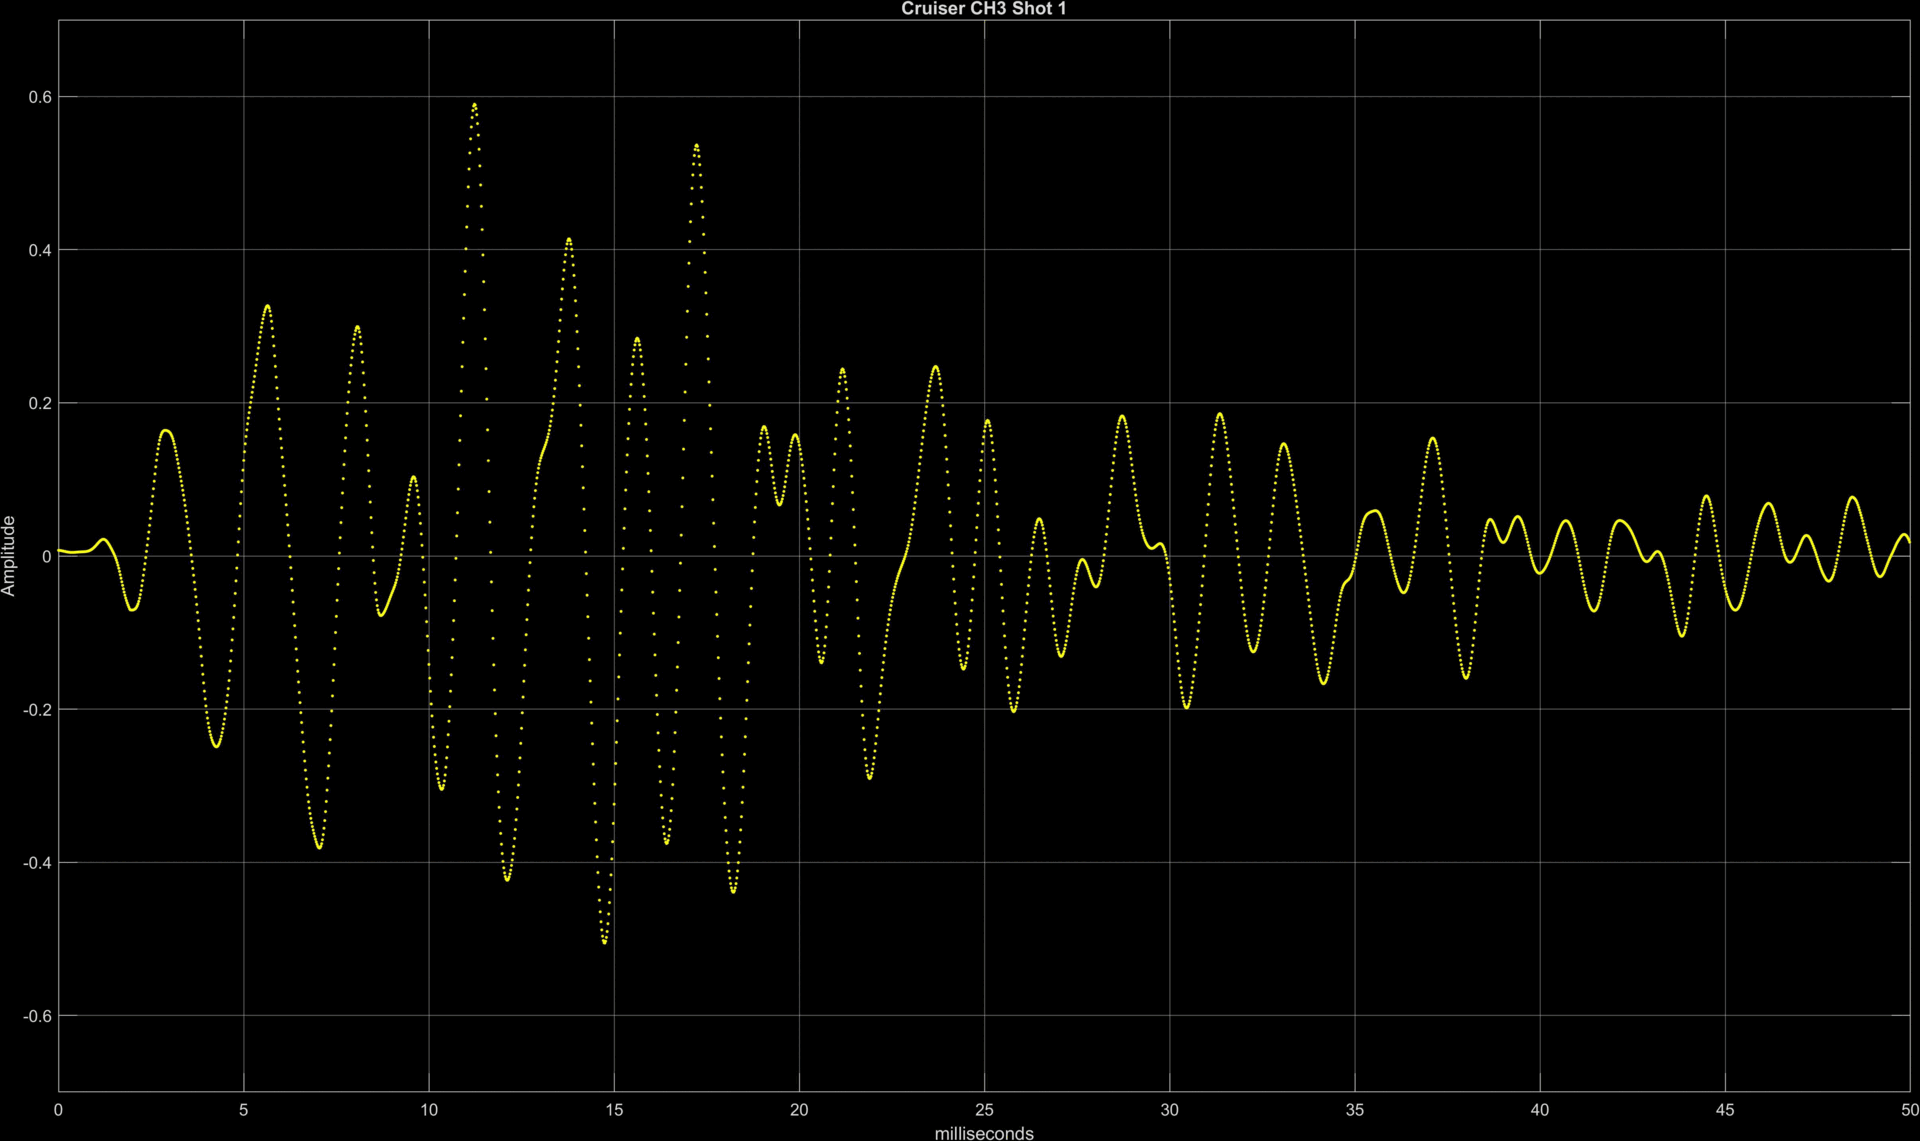
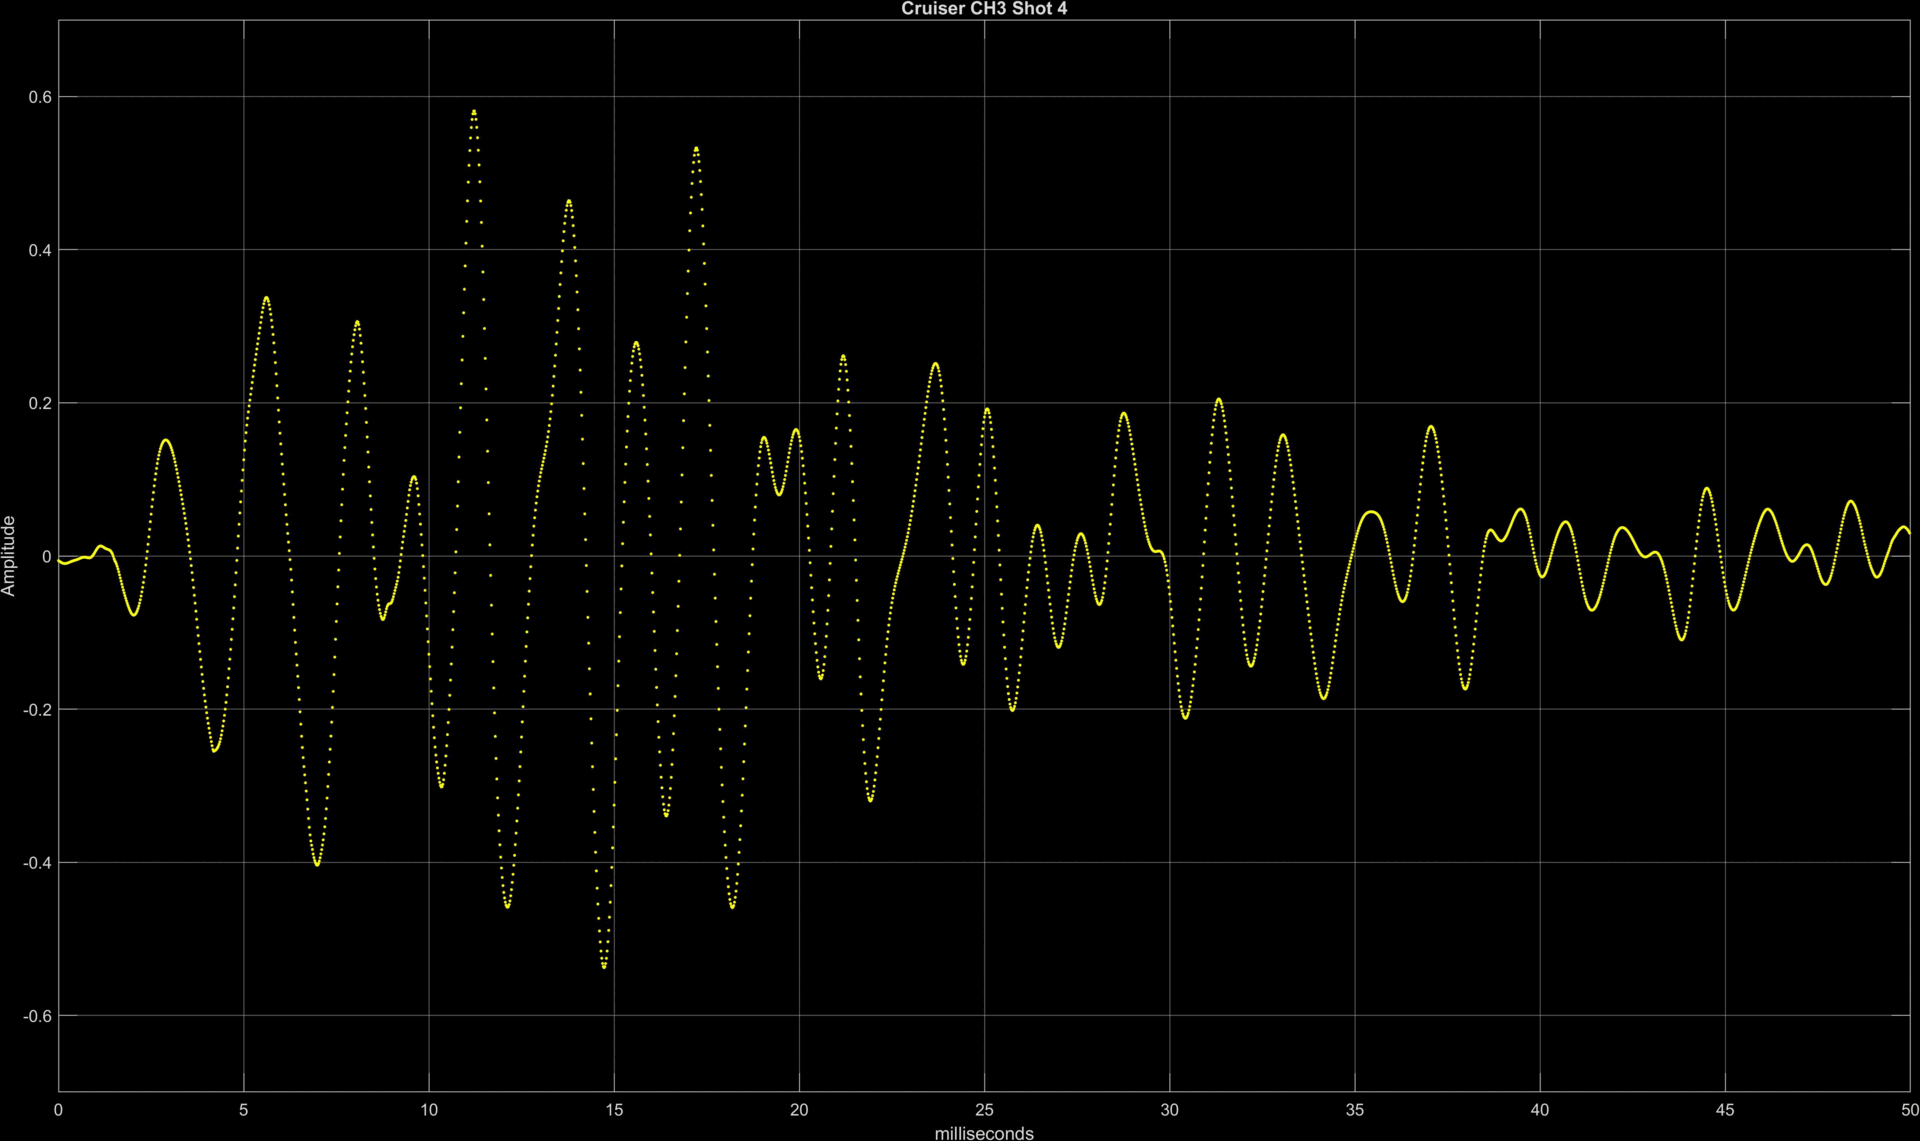
The Police Cruiser audio data has Shots 1-8 looking suspiciously similar when viewed in Audacity. Was this a cut-and paste job? I decided to take a close look at the data in Matlab.
ffmpeg says that the audio channels in the Cruiser MP4 file were all AAC format, so I extracted the first 7 minutes of the Channel 3 audio file like this:
ffmpeg -i “Police Cruiser 1382_202407131806_Unit5-0.mp4” -t 7:00 -map 0:3 -vn -acodec copy cruiser.aac
Then I pulled the data into Matlab:
[a,Fs] = audioread(‘…\Peak Prosperity\cruiser.aac’);
If anyone sets up a poll with a time limit, be aware that the date/time are GMT, not your local time. I had planned to keep that poll open for 4 hours to give time for more people to see it. Sorry.
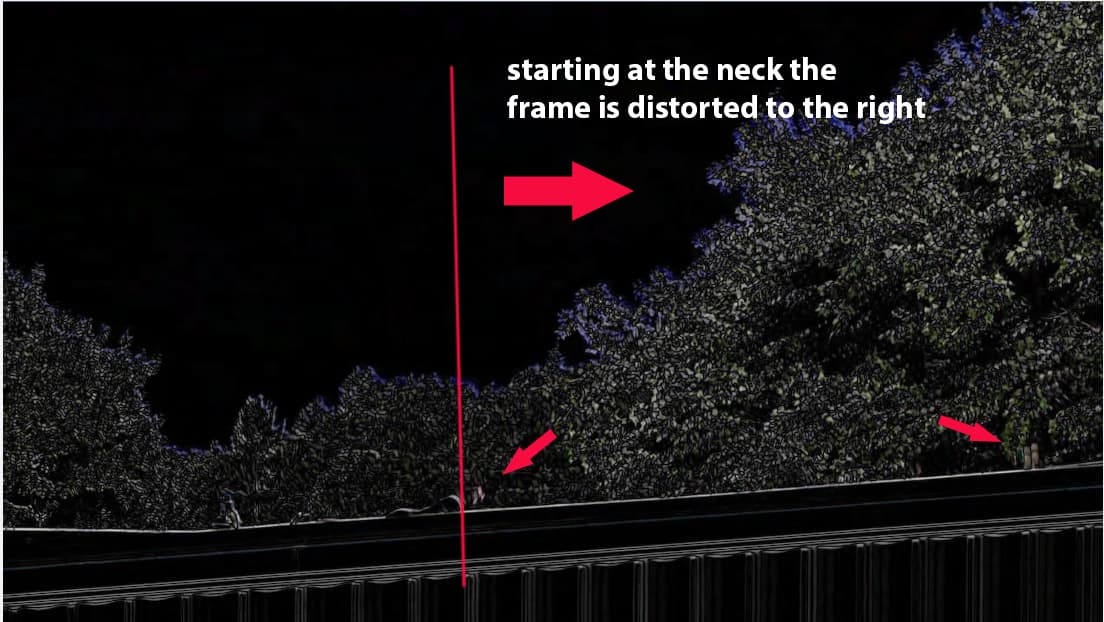
Sorry, I don’t agree, we are talking about distortion exactly at the position of Crooks neck, after four weeks of people complaining that there was no recoil of the riffle. If you mount the video back to an animated gif and set the head as the fixed point, it will move the body backwards, simulating the recoil. This seems to be precise human intervention trying to add the recoil of the riffle in this new version from last Sunday.
Geee. We learnt to use autocorrelation, theoretically. But this is a digitalized sample sequence and with natural sound the phases not necessarily match.
Thank you, I hope I can find time tonight or tomorrow to go through these in detail. Here are my initial thoughts.
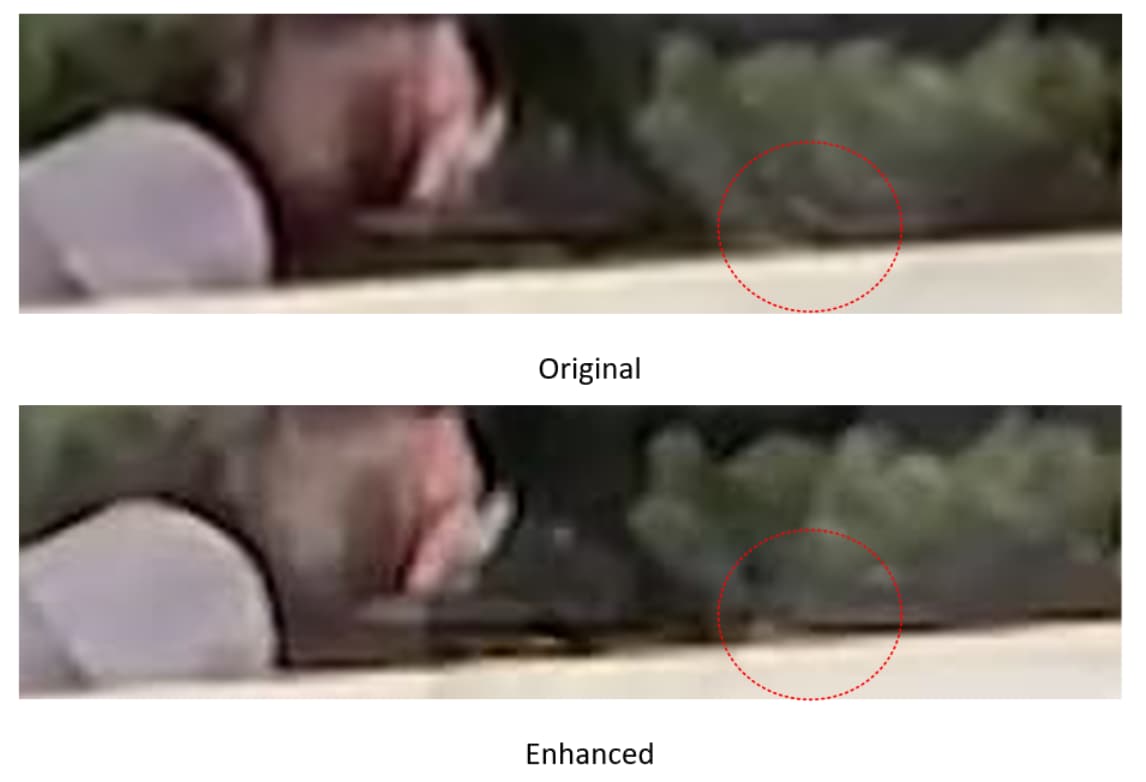
a) It doesn’t look like TMZ “found” more data in the file, it looks like they applied an unsharp mask or some similarly primitive sharpening filter to the original. Filters can’t create data. In the case of sharpening filters, they typically work by creating overshoot in the response at edges, which tricks our eyes into thinking something is sharper. Where there is inherent blockiness, this creates artifacts, like all the little rough texture in the grey shirt at its top/front edge.
b) a sharpening filter will never remove a real feature, it will just make it look “sharper.” In the crops below, look at the spot a few inches in front of Crooks’ glasses. It is there in the original, it is just blockier in the enhanced version.
c) now look at the diagonal feature I have put a red circle around in the original. It is more prominent than that little speck in front of Crooks’ eye. I think it is either part of the barrel or maybe Crooks’ thumb. Who knows, doesn’t matter. But when you look at the “enhanced” version it is gone, obliterated, see ya. Replaced with grey mush. A “sharpened” or “enhanced” filter response wouldn’t do this, it would make it appear more prominent. This has all the fingerprints of a manipulation.
d) which brings me to my last point. That SAME diagonal feature is prominently highlighted in the next frame, and looks like the last frame of a tumbling casing to our easy-to-fool eyes (it was “missing” from the prior frame"). But if it was there in the frame I had highlighted, the “casing” would seem to have jerked downwards suddenly and unnaturally, and then hovered, which isn’t anything like a falling casing. So they took the feature which clearly isn’t a falling casing out of the first of the two frames and left it in the second.
Video coders are strange beasts and no one can ever know for sure after the fact what the original data was. But the rest of the local area of this frame looks like a sharpened version of the original, so we have to ask why did the higher-res version drop this oh-so-crucial feature?
What is the wave length of 1 kHz sound? Is it about a foot?
Barricaded sound propagation is something wave mechanics.
Is the Huygens-Fresnel principle applicable for sounds?
Could you make a version of this with just the first four waveforms? After that, the energy of overlapping shots (whether real or pasted) starts to overlap…
Yeah, that is along the lines what I’ve written right now – except for the scaling, because R has a builtin correlation function. But I still thank you for the algorithm, also because I just learned how a correlation function works at its heart. Yet testing the script is rather slow, even though I used the 10 interesting seconds only (at a sample rate of 48 kHz) and a sample of 0.2 s taken from the first shot.
This is truly weird. Perfectly sinusoidal noiseless waveforms with the same peaks and zero crossings. It’s like someone generated these synthetically by “randomly” slightly tweaking the amplitude of one or more frequency coefficients.
I have lot of questions in my head. How to explain briefly…
In some other field it is possible to study the correlation between regions of same wavelength. So called region size of compatible wavelength.
What does it mean? At the given frequency 1 period sine should taken, and, let’s say, project the sample to that base (in Hilbert-space). And we might correlate those regions. Now it is a function of time delay and wavelength. (Actually it is a possible/promising theory of quantum gravity. (Hooks of space.)) Haven’t I missed the phase? Then sine and cosine both needed.
VLC plaer was unable to export raw audio. It is not pure PCM(1) but some compressed(80). I should install ffmpeg.
Meanwhile I try to understand how the window glass attenuates the sound. Unfortunatelly there is no Lagrangian function of the dry Coulomb friction, so it is weird to describe with a row of atomic level dissipative harmonic oscillators.
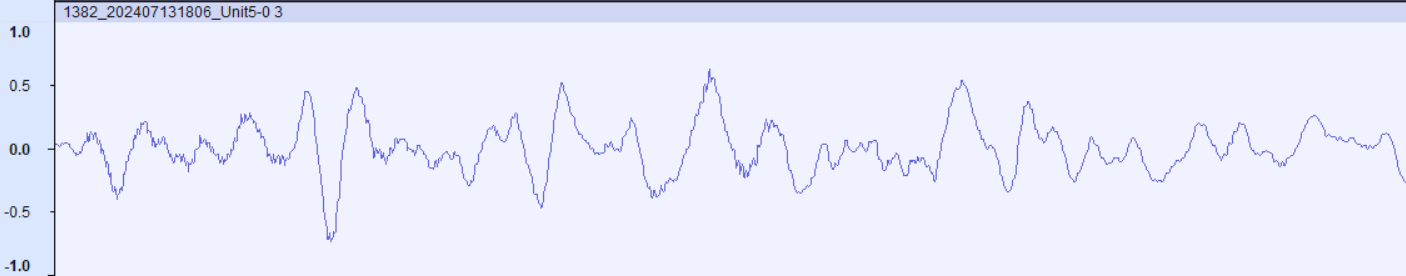
When you look at how the cruiser recorded shots 9 and 10, it didn’t come close to killing high frequencies. Here is shot 10, same channel Greg just captured:
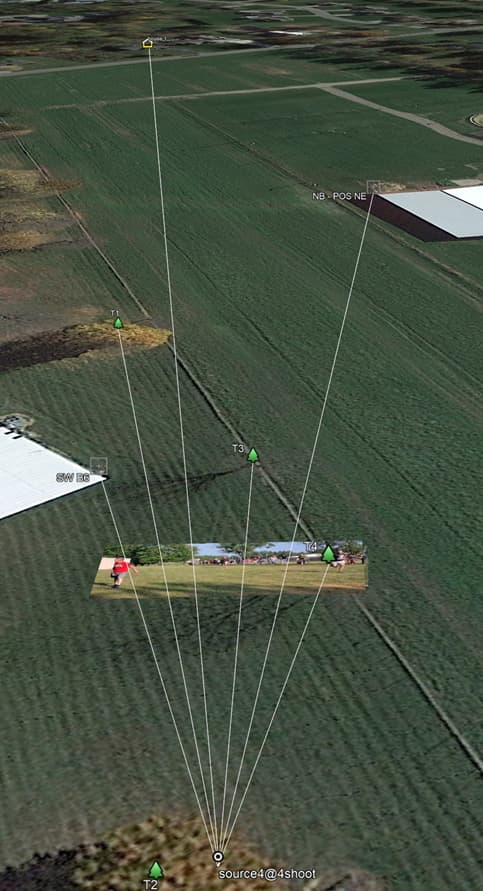
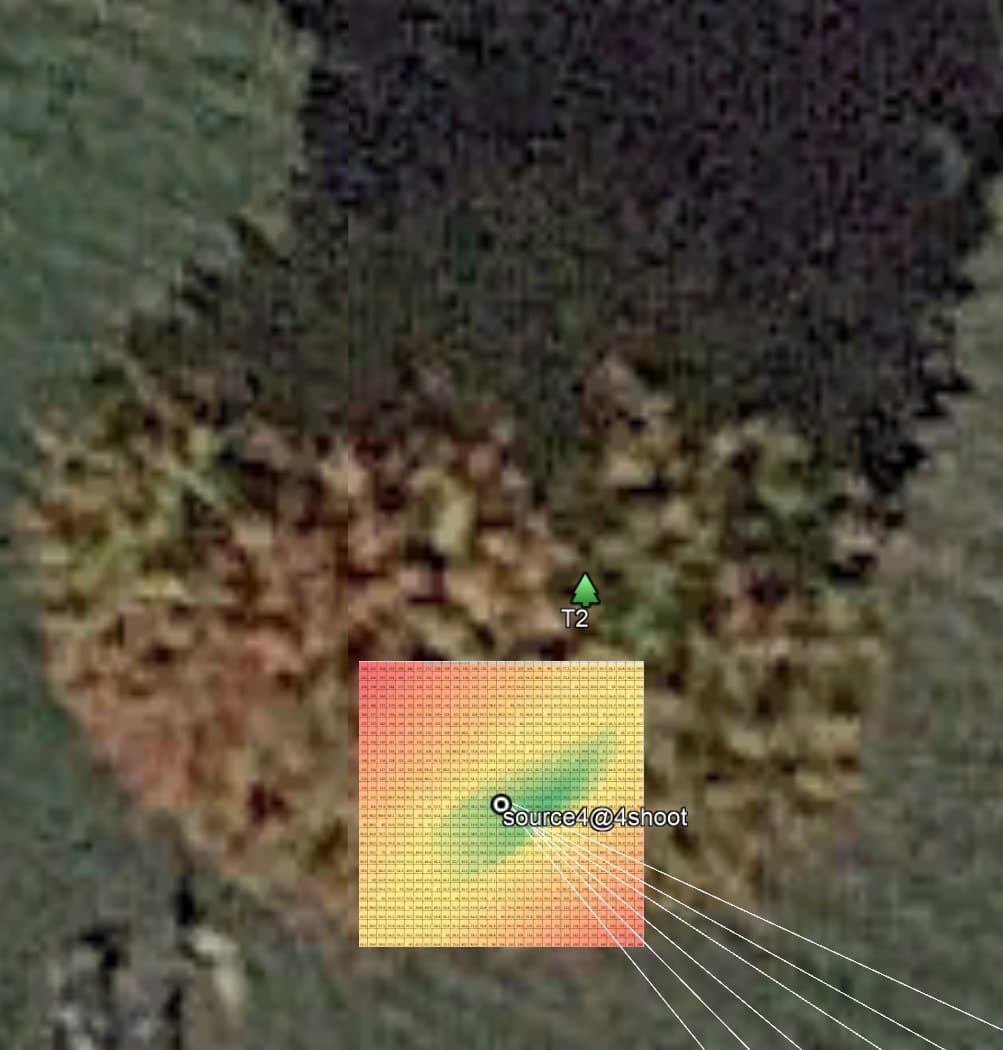
I been trying to improve my method for geolocating the footages.
My original method consisted in defining objects on the Google Earth, defining a possible location of the footage, inserting the image on the map to fit all the points. After I try to adjust the location of footage to better fit the image.
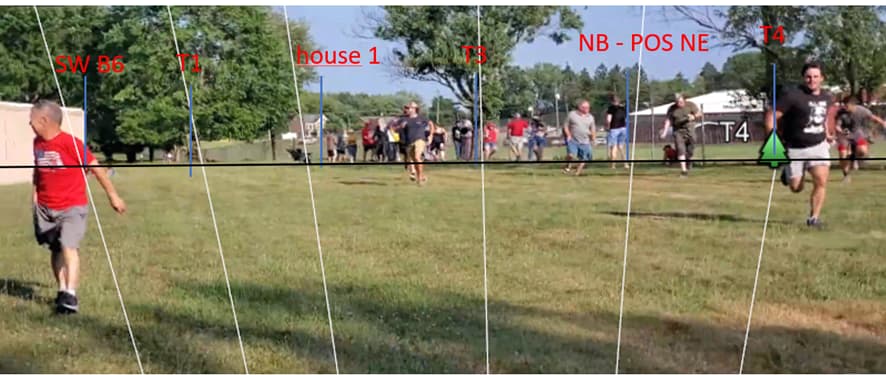
Here is the footage from source 4 at shoot 4, with the lines of sight (in white) of each reference point, reference positions (in blue) and the name (in red):
The match is not perfect. So, I’m tring to use math to solve the error of position predicted from the measured in the footage in pixels.
The angles of the reference geolocations to the footage geolocation are measured then converted to pixels, and then measured the error to actual footage, in the original location I got a medium error of 33 pixels, for a total lentgh of the footage of 3264 pixels. Then I run a test for various locations near my first guess. The result is a map of error in pixels, the green region is the location with minimal error.
The best location is 0.67m to the East of my original location, reducing the medium error from 32 pixels to 27 pixels. That is pretty good. But I’m still trying to improve my method. If anyone want to give me an insight thanks in advance.
Here are the locations used, and the pixels measured in the footage from source 4 at 21.556sec:
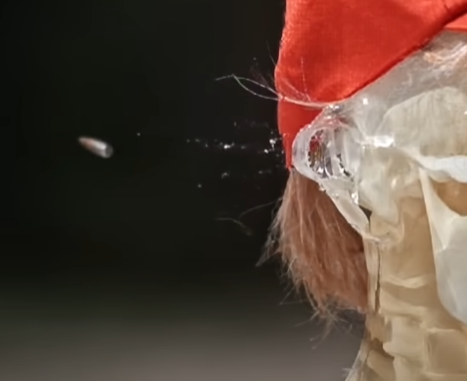
I don’t believe one can make that direct conclusion, because almost any “hit” (and we don’t know exactly the injury) would likely throw the bullet trajectory off even a few degrees. Here’s an example from Brandon Herrera shooting a dummy Trump head/ear with a 5.56mm. This minor impact causes the bullet to yawk and start to tumble.
A trained sniper (and I assume this theoretical person would have extensive military and police training/experience) would be unaffected by the heat from a attic over a short period of time. And at most we’re likely theorizing perhaps 445pm til 615pm, a trivial amount of time to endure some attic heat. It could have, theoretically, been as few as 10 minutes if we were to go with the theory that GN was the helper/lookout to keep others out of the building and there was another shooter climbing into and egressing from the snipers nest over a period of maybe 10 or so minutes.
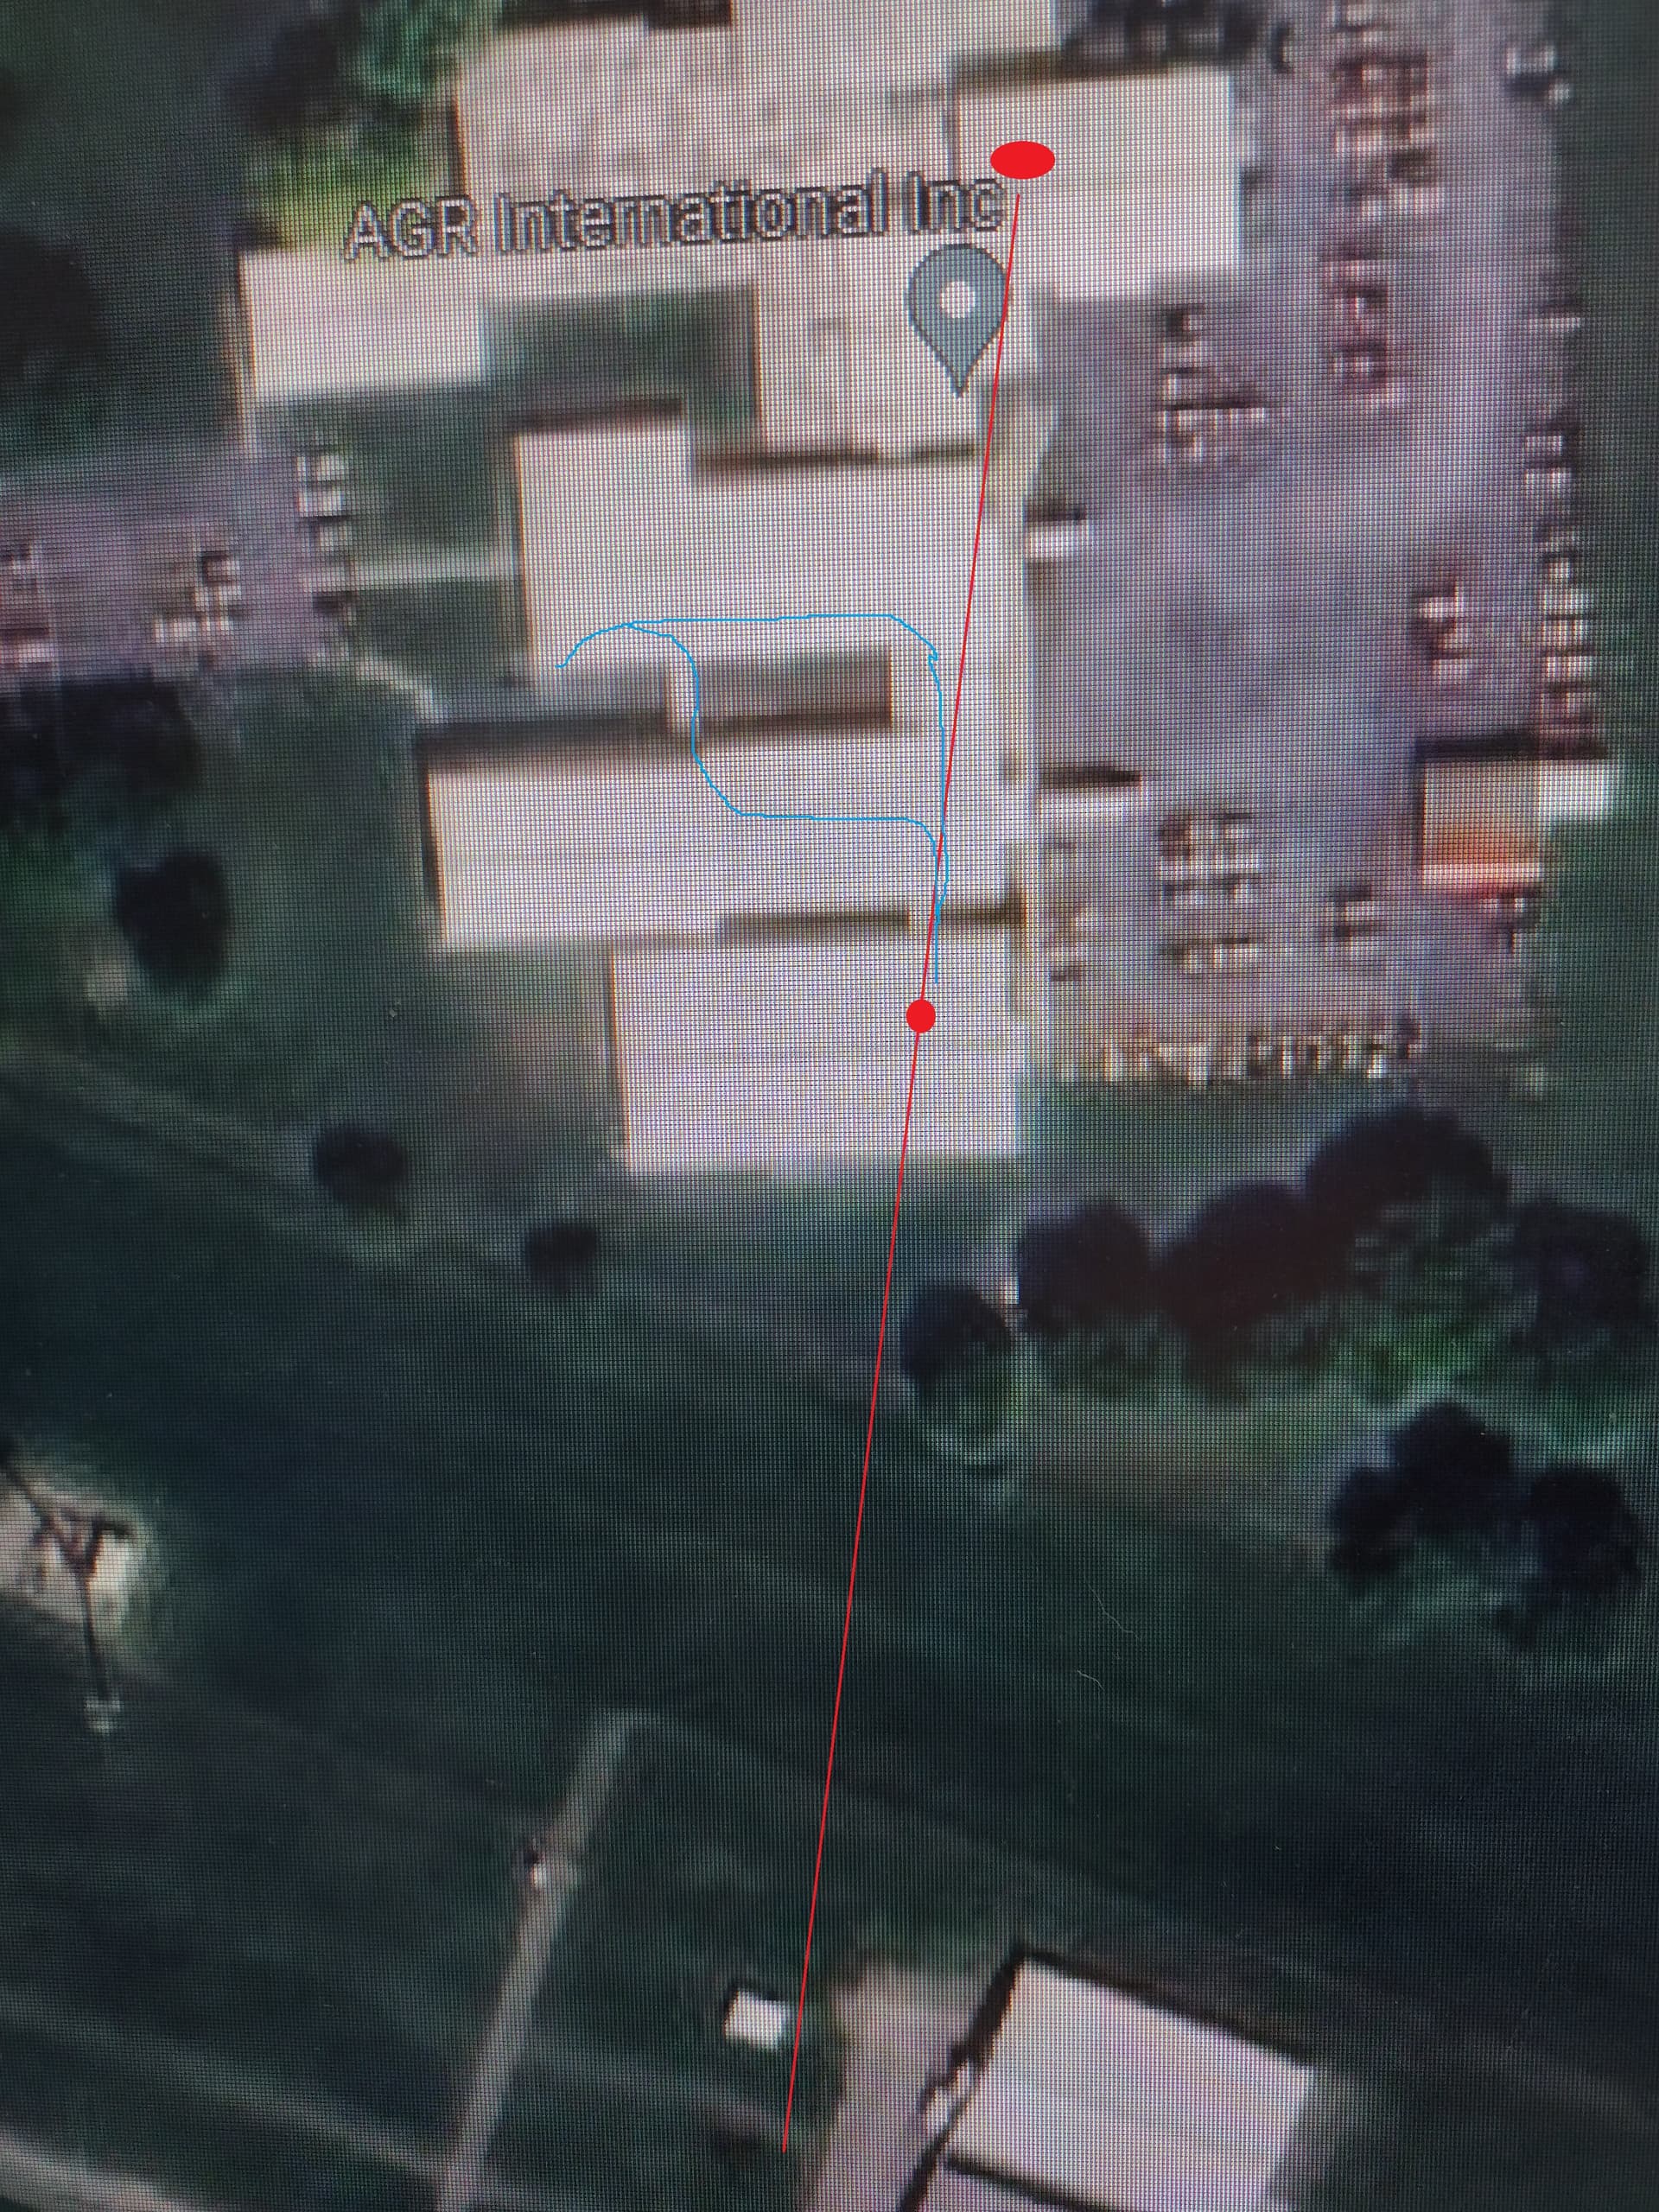
2nd floor 3rd window is a possibility we cannot rule out. However I think we can conclusively eliminate all 1st floor AGR#6 windows. It has been “proven” (I think by a Congress rep) that they do not open and we know none were broken, and furthermore the lower portions have a field of fire obstructed by the fence and bleachers. These windows are a dead end.
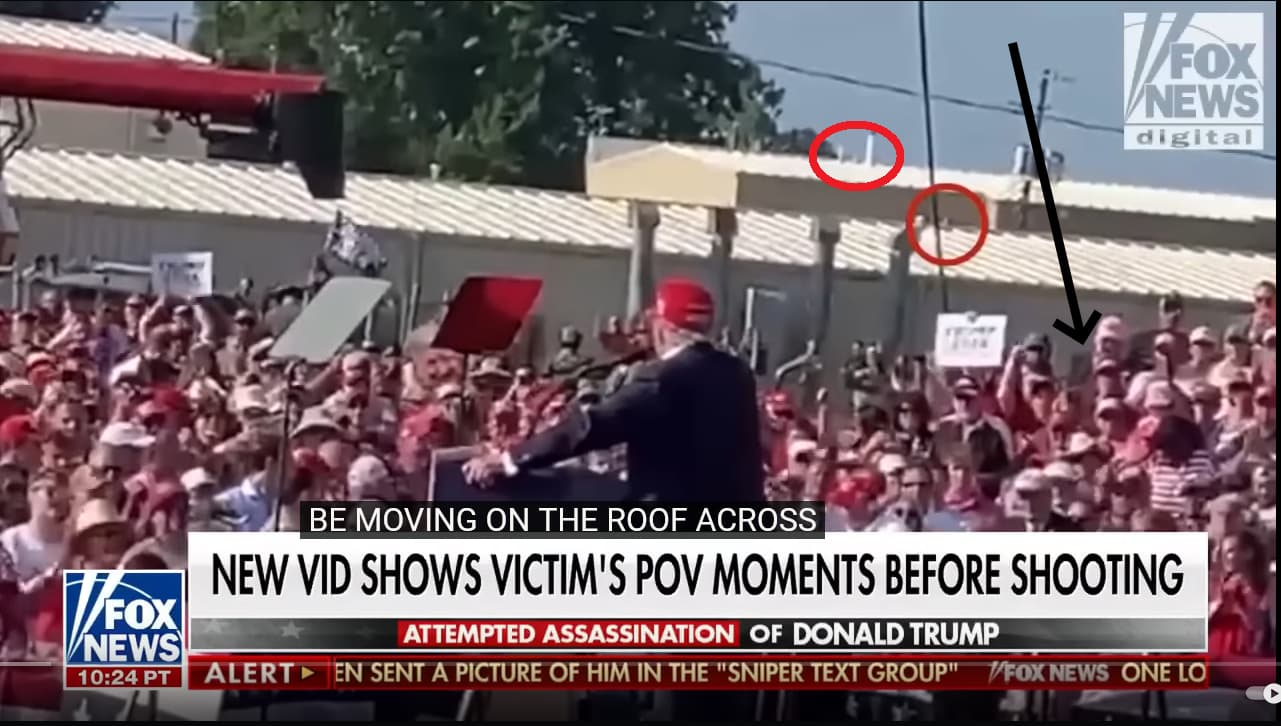
There’s literally nowhere else on the roof next to Crooks for a 2nd shooter to “hide,” during or after the shooting. Far too many witnesses and video angles. Where could have have gone? There were 100 sets of eyeballs on that roof.
The vent is viable, the 2nd story window is viable, and the 2nd story rooftop is viable in my view. And if I were the pro, I’d have chosen the latter.
I believe I can see slight recoil on his right shoulder and his left foot. It’s nearly imperceptible but I believe I see it. I think you’re under the impression it’s going to be super obvious but the AR15 simply is so popular in part because there is almost no recoil, making it very easy to learn to shoot. Just like you’re not going to see “rifle smoke” (and you keep mis-spelling rifle), seeing recoil under these circumstances will be difficult at best.
If you watch the video @daniloraf posted a few entries above yours you will see a slow-motion video of someone firing an AR15 and the recoil on that closeup slow motion video is minuscule. It would be very hard to see on a zoomed in low quality cellular phone video from 150 yards away, such as this.
Correct, virtually no recoil and would be very hard to see on a shaky cell phone video camera from 150 yards away. Saying there’s no recoil observed is inconclusive at best.
The evidence shows that Crooks had the rifle in the normal prone firing position during the first audible shot. Whether the took that shot is up for honest debate but the rifle was clearly in the normal upright firing position so the opinion it was canted is plainly incorrect.
Having owned, fired, trained with, and deployed to war with this general rifle platform (AR15 or M4), the ejection pattern is generally strong and to the right, and can be rearward, sideways, forward, or anything in between. There are endless variables but YT videos in slow motion show these cases come out hard and often deflect on the “brass deflector” protrusion rear of the ejection port so they can go any direction to the right. I’ve never seen any go to the left of the shooter, however. On this ribbed roof they would be contained within 1 of the sets of ribs and would not roll down very far because of the tapered neck design, they’d roll only a short distance before being stopped by a rib in the roof.
As for why the shell casing count was initially 5, then 12 minutes later 8 shots, and the odd placement of those 3 other shells, it suspect. I would expect all 8 casings to be to Crooks right side, within close proximity. Apparently some where to his left which is inexplicable and almost impossible absent interference. I would like to see an actual aerial diagram of the exact location of these 8 shell casings but I doubt that will ever happen since the crime scene was quickly destroyed.
I can’t get into the mind of whoever shot at Trump and murdered and injured people. However it would be reasonable to believe the first volley was slower and well-aimed because Trump was stationary and exposed. The second faster and less accurate volley was because Trump went down and was covered by SS agents and no longer exposed so the shooter of the 2nd volley was laying down a larger number of shots to increase hit chances.
The 3rd window offers some benefits, but also problems. It could presumably be seen from those on the ground and by the other counter snipers, possibly. Another issue is trajectory, I haven’t focused on it in detail but I wonder if it is too far away from Crooks trajectory to be a viable location?
If GN “took a walk” and a pro-stepped in to do the job, that’s certainly a possibility.
The false ceiling sniper nest has some real problems, one you have pointed out. I have not scrutinized the videos but I have reviewed them and never observed any movement of any of the vent flaps to an open position - and the vents would have to be wide open. The shooter would have to be deeply recessed to avoid detection, and shooting thru open flaps would add a significant layer of difficulty. For those flaps to open fully, and close, I would think we’d have seen that on the popular video of the scene.
I’ve been saying this for 4 weeks now, and @howdoiknowthisinfo has done great analysis on this 2nd story rooftop too.
Of all locations I think it is the most ideal because it offers a similar trajectory only 3 meters taller than Crooks position, excellent situational awareness of the law enforcement, Trump, the crowd, and Crooks getting into position. It’s easily accessible just as Crooks got onto the roof as well. I believe an assassin in a white painter type suit could have hidden up there in advance due to the facade walls on the N and E rooftops, fired his shots, and escaped. During the chaos, slip off that back wall and disappear.
Even looks like a head poking out in between these roof vents in one of the videos.
Hidden from all 4 counter sniper teams. Both Hercules teams obstructed by trees, the counter sniper teams in the 2 story AGR building are facing the wrong way, and the retention pond S. team is obstructed by a building and crane arm and trees and poles and other obstacles.
Best area for total situational awareness to the S and obscured from the N and E, with minimal exposure to the W. Easy access and escape paths while everyone is focused on Crooks. Just hop down and scurry away.
Trajectory almost identical to Crooks, just a few meters taller.