Hey @greg_n here is the solution for the bullet sonic boom (crack) time.
Positions:
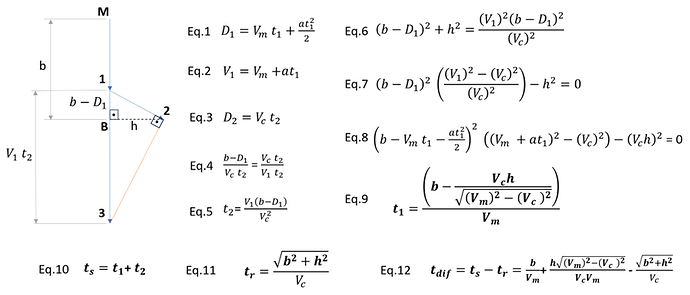
M – muzzle position;
1 - bullet location where sonic boom is emitted;
2 – receiver;
B – perpendicular position of bullet trajectory (M:3) relative to position 2;
3 – bullet location when sonic boom is received on 2;
Deduction:
Eq. 1 and Eq. 2, define the position and velocity at position 1 using kinematics equations.
Assuming a constant deacceleration will be good assumption based on my simulations of ballistic calculators. I had calculated the reduction of speed and estimate a medium deacceleration.
Eq. 3: is the sonic boom distance D2 to the receiver (1:3).
Eq. 4: the right triangle 123 is similar to the right triangle 1B2 therefore the sides and hypotenuse are proportional.
Eq. 5: Isolating t2 from Eq 4.
Eq. 6: Applying Pythagoras on the right triangle 1B2 and using Eq.5 and Eq.3.
Eq. 7: rewriting Eq. 6
Eq. 8: substituting Eq. 1 and Eq. 2 on Eq. 7
Eq. 9: assuming a=0 from simplified model and isolation t1 in Eq 8.
Eq. 10: Crack time is the sum of the time of bullet from M to 1 and time of sound from 1 to 2.
Eq. 11: Applying Pythagoras on the right triangle MB3 converting distance to time for the sound of the report from M to 2.
Eq. 12: Simplified solution time difference (crack – report) for a=0. Derived from Eq. 9, Eq. 10, Eq. 11, Eq. 5, Eq. 1, Eq. 2.
For the complete solution with deacceleration depends on solving Eq. 08 witch not solvable by radicals, so I used newtons method. For that I started the method at the time from equation 9.
After finding the solution I compared the simplified solution for Trump position using medium velocity and the complete solution with deacceleration. I conclude that using the medium velocity the simplified solution one (Eq. 12) is almost the same result. ![]()
![]()
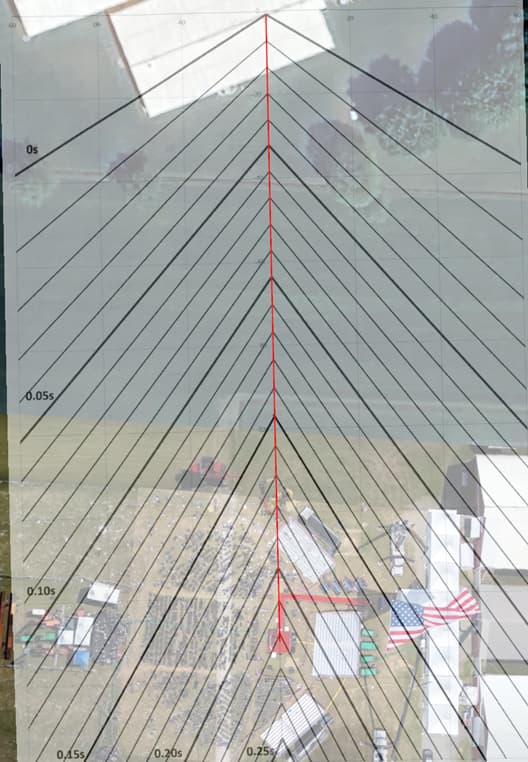
Plotting the solution in the line fire, I manage to create a chart representing the time differential of crack and report. Where Stew was the probable time differential is 0.03s.
(edit) The lines in the chart are isolines where the time differential is the same. For example, at Trump position is around 0.22s but for someone on the North-East part of the middle bleacher would be around 0.17s.

