Well. I agree.
And NOT a wild theory at all because I saw your trajectory plot. AND not many folks know this fact but shots came IN to Trump on the Stage from 800 feet away. Approx.
Well. I agree.
And NOT a wild theory at all because I saw your trajectory plot. AND not many folks know this fact but shots came IN to Trump on the Stage from 800 feet away. Approx.
Please explain how you think you know this. Thanks.
Has anyone digested audio to corroborate John Cullen’s assertion that there were subsonic shots?
I remember early-on seeing the north counter-sniper team seemingly flinch on video and thinking they must have had something come their way. In time I understood those reactions occurred before the 3+5 rounds. So it was puzzling until hearing Cullen’s suggestion.
Well - back to basics - the CBS Stage Mic picked up the shots from approx 800 feet away coming IN to Trump on the Stage. I mentioned this to the Team some days ago (as had been trying to get someone to plot that curve on the Site Plan.)
And subsequently have been waiting for a few days for a sensible 2nd/3rd Shooter location to reveal itself. So well done EVERYONE. I think where Big Tim drew that in and the clothing suggestions were very reasonable and accurate.
This location for 2nd Shooter also covers the echo situation too at approx 195-200feet.
Did you do the math about what the muzzle velocity of the round would need to be for the crack-boom difference to be 0.22s over 800ft?
I feel the pain…
Have you been thinking about this: If it was two shooters, one firing the first three shots and one firing the next 5, then the time between shot 3 and 4 would be slightly different on different recordings with different angles to those two shooters. If we know the position of one shooter and the positions of many microphones, we can determine where the other shooter was. At least theoretically. I am not capable of doing this, but still I am launching this idea. Good luck!
CLEAR PROOF ~ TWO (2) SHOOTERS. No gray area, no maybes, no question – TWO (2) SHOOTERS.
3 bodycam videos were released to Senator Chuck Grassley. On the 1st one [https://www.youtube.com/watch?v=hzus2Ilw-mg&rco=1] where SS, FBI, & other law enforcement congregate atop the roof where the shooter’s dead body lay, 2 men in camouflage with bodycam tell colleagues, “Watch out for shell casings (meaning “look for”) . . . (then counting) 2, 3, 4, 5 right there.” In other words, there were only 5 shell casings found near Crook’s body. This is at the 7:54 mark. In conjunction with Dr. Martenson’s audio it’s undeniable proof that Crooks did not fire the initial 3 shots – which included the one that hit DjT. It’s also proof he fired the next 5 which were followed by Shot #6 (?) + 1 shot from the sniper that took him down.
More confusion . . . Crooks either knew, or did not know, that another Shooter was part of the Grand Scheme. In either case, once he heard the initial 3 shots & watched his “target” go down, what did he expect to shoot at??? Either way, he had to know he was the “decoy” – or, the “sitting duck”. . . or better yet, the “patsy”. Then again, maybe he knew it was a “suicide mission” from the very beginning.
I have a strong feeling the FBI’s final report of this attempted assassination is going to be as laughable as the “Warren Commission”. Keep up the good work – America & Patriots need your insights & vigilance . . . RnB
Yeah, but then later in the video that same guy counts 8.
As much as I think two shooters would be plausible I cannot back that up with the actual evidence.
My 3D model is very consistent with the first bullet coming from Crooks position. I used James Copenhaver camera footage to fine-tune the model, because Google Earth elevation is not accurate enough.
Here are the link’s to my model: 1; 2; 3; 4; 5; 6
We also have Greg TDOA model on Mathlab. And here is his video demonstrating the model, with old data. Here is his latest findings with more accurate position of each source.
If there was a second professional shooter he would not miss. The ballistic simulations resulted in 4 inches drift from wind, which is can be compensated.
In Chris’s discussion with Peter Boghossian, The Whole System Needs To Be Burned Down (8/9/2024), it was apparent that a crucial detail has become lost.
Chris Martenson (17:08.854)
and I can show you this piece right here … This right here we have a video recording [labeled “Now For Audio From Video #2] and … you can hear two separate weapons clear as day. One is muffled and goes [took, took, took] and it has no audio echoes …
Chris’s original examination of the shots, Audio Analysis Is Most Consistent Two Shooters At Trump Rally (8/5/2024), did find, and measure, the audio echoes for the first three shots. They were earlier, but they did exist.
Chris Martenson (18:38.826)
[For three shots] … that shot sound also went somewhere else and bounced off the surface and then came to the camera. And here we can see it’s an average of about 0 .08 seconds when I measure them. It’s a little imprecise, but this one was 0 .083. This one was 0 .077…. That time gap right there, 0 .08 seconds, is consistent with a reflective surface that that sound from the gun blast had to travel another 90 feet.
[For five shots] … This is the echo at 0 .17 seconds away…. we can’t have the echoes come from such entirely different spots because this at 0 .17 seconds, this echo has to be coming off of a surface that is now closer to 195 feet further away.
The echoes in shots 1-3 have implications, but not the ones Chris originally thought. He took the large change in delay to mean a large change in shooter location. But it can also mean a change in reflective surface. This is counterintuitive, but the pathological geometry here supports it.
I would appreciate anyone checking what I consider these “green” facts:
If these facts are green, and greg_n’s TDOA analysis is green (all shots fired within a few meters), then One Shooter is green. Which is kind of important. So please help check this.
[quote=“Tinner, post:275, topic:41479, full:true, username:tinner”]
We need to add WHO was the person who bled all over the bathroom because as you (Chris) showed the LEO that was pulled up on the roof didn’t have any issues like that.
Also this video at 12:26 shows someone leaving on a bike from under the water tower. Just needs investigated more.

One last thing
This video shows that there us SS INSIDE the building was on .
Start at 9:12

And WHERE the hell did the SUIT SS come from??
I think I remember one or some of the Black Suit US-SS came across the field from the general stage area.
That’s right. See Dayve’s video.
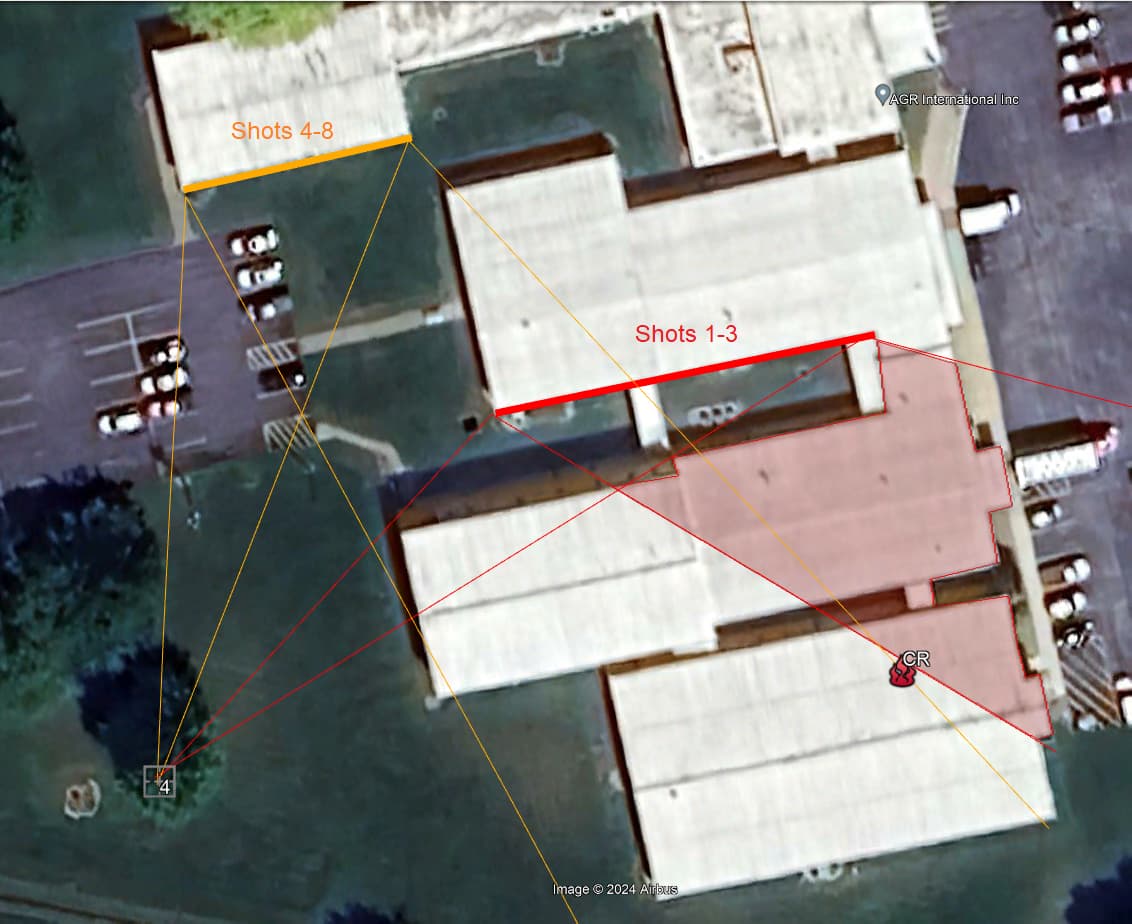
I did this, if you look at my posts above. When you solve for the position solution, the data is inconsistent (no solution that makes sense) with line-of-sight audio from the first weapon to all of the sources. To put it as simply as I can, TMX and DJStew both indicate that the source of the first three shots was ~20 feet further away than the source of the second five shots, when compared to the stage mic. But this would be impossible assuming all eight shots went in the same general direction from the same general area. Which everyone seems to agree on.
The data IS consistent with the shots 1-3 shooter being concealed in the building roughly underneath Crooks, and the sound for those three shots having to take an indirect path to reach the TMX and DJStew microphones that are off the line of the shot.
That was the lady on the horse leaving. Watching that bodycam video closer its easy to see the gallop. She was relatively close to the water tower when shots were fired, so it’s a logical exit route for her.
Edit: The guy pushing this is IN2THINAIR.

He previously pushed the “zip line” escape route of the alleged tower shooter.
Greg_n
re.*** “I describe the details of my approach in the YouTube video 1 I posted 5 days ago.”***
[my illustrative visual graphic is posted at the end of this comment]
Your indicated youtube video is excellent – it helped me understand how I think about the situation and explain it to others. I have thought more about your comparative audio analysis approach and have some observations.
You reference TDOA - I think I have a basic understanding generically of what TDOA (time-difference-of-arrival) methodology – minus the complex mathematical modeling/calculation approaches used to solve various 2D logistics problems.
For example, TDOA seems to be conceptually at the core of the analysis that Mike Adams and Chris Martenson did to estimate shooter distance from the Trump mic – by comparing sonic crack (SC) and gun-report (GR) time differences – recorded in audio tracks at the Trump mic at the rally podium on July 13th. I apologize in advance to the pros if I am using a term of art incorrectly.
TDOA conceptually also can be at the core of comparative audio signal analysis for two or more sources of signal for the purpose assessing distance and location if you have two (three?) or more signal sources.
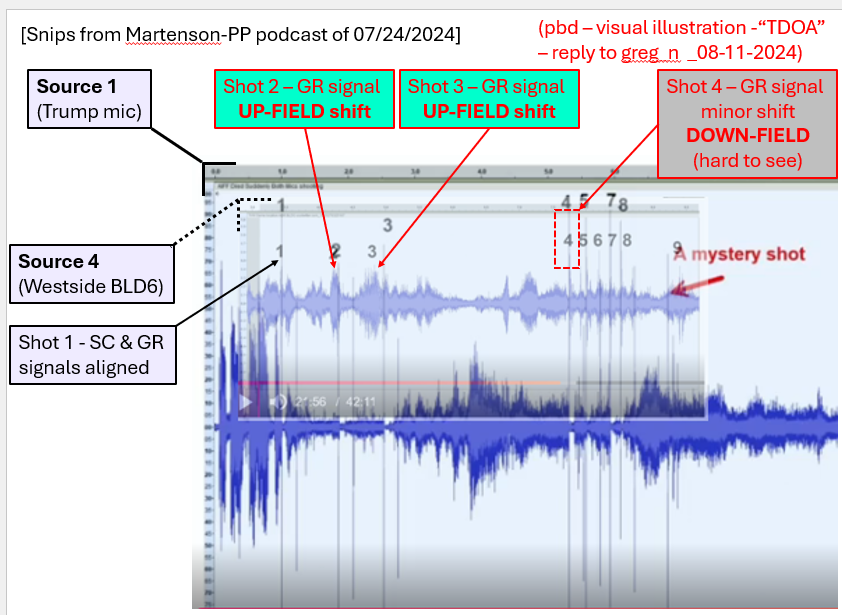
From your video it appears that you are doing the latter TDOA at least conceptually - wherein you use and sync (align) audio tracks for the TDOA comparative analysis by using the SC for Shot 1 in the Trump audio track as the reference “zero” time-point – and then align the GR signal for Shot 1 from each of the cell phone audios that you want to compare.
I have recapitulated your method but using a much simpler (for me) visual approach of overlaying for example the Trump mic and Source 4 (referred to by CM as “Video of side bldg NYTimes/YMV)(aka – “westside of BLD#6”). The Source 4 also corresponds to the higher definition video released by Piper Grimley recentlyl (I think) – and discussed by Chris Martenson.
I am not using the Source 5 (TMZ/ “Ross get over here”) video/audio – because of the mic position being roughly orthogonal to (to the side of) the BLD2 second floor south facing windows. And because the signal-peak analysis is more difficult. Just to be clear- this does not mean that I believe there must be line-of-sight to a shooter location to use/get value from audio data analysis.
For my present illustration (see visual graphic below), I also am not using (right now) Source 2 (“He’s got a gun) or Source 6 (David Stewart) for my illustration - for other reasons which we can discuss later.
Below is a visual graphic OVERLAY of Source 1 audio (Trump mic) and Source 4 (cellphone mic – westside of BLD#6) – wherein the Shot 1 GR audio signal for Source 4 is aligned with Shot 1 SC audio from Source 1 (Trump mic). Please note the positions of Source 4 GR signal peaks for Shots 2 and 3 relative to the corresponding positions of Source 1 SC signal peaks for the same Shots 2 and 3.
The Source 1/Source 4 (TDOA) comparative analysis findings clearly suggest 3 Shooters (I think it shows 4 – but I have the benefit of other better analysis approach and other comparisons).
Note – I think that Source 6 (Stewart) audio is a red-herring (perhaps adjusted by the DS) – to make it look like Shots came from the same source – and is partly why your TDOA got the results that it did. Your inclusion of the Source 6 data set may have obscured/confused the shooter locations.
Also, my sense (for me) when comparing audio tracks immediately quantitatively before a qualitative analysis that gives me a road map - is risky because of my (human) error in making assumptions and specific measurements off of audio track plots.
Critics will say that I am inserting bias - fitting the data, yeah maybe/NOT. I have been groping around in the dark for weeks on this banging my head on the corner of the coffee table – and dropped down many dark rabbit holes that end badly (getting-my-knickers-in-a-twist) – so - yes I will use a qualitative and intuitive approach as “radar” first – to avoid some of the bumps in the road and dead ends . . . .
I think Source 2 comparative analysis confirms and supplements the findings and conclusions regarding a potential 4-shooter hypothesis. I did not use Source 2 for an illustration because I want to get a better-quality Source 2 audio track plot that has a reference time-bar-metric. Using the one I have would just raise questions about relative scaling etc. – that would distract from the message and insight into the relevance of audio signal shifts across multiple soundtrack sources (I think).
Again, I thought your youtube video was excellent.
All the best,
pbd
PS – regarding your other question – regarding the factual predicate and analysis for how I reached a specific 4-shooter hypothesis will have to wait for a different post – this comment is already too long for most.
PPS – to re-emphasize – the visual graphic overlay (shown below) has some preliminary profound qualitative value for illustrating generally a multi-shooter hypothesis – BUT is not good for quantitative and specific analysis of the specific DS strategy and explaining the same – re. the Plot to Assassinate Trump (PTAT) – again I have been down this rabbit hole many times – and (for me) it leads to unnecessary confusion and quantitative false leads potentially.
Speed of sound is calculated as follows:
v = 331.3 m/s x sqrt(1 + T/273.15) x (1 + .0124 x H)
where T = temperature in ºC and H = relative humidity
According to Weather Underground at 5:51 pm:
T = 93ºF or 33.9ºC
H = 34% or 0.34
So v = 352.74 m / s = 1157 fps
The wind speed at that time was 7 mph or 10.3 fps WNW almost perpendicular to the shot direction of SSW. I estimate a -2 fps affect on the speed bringing v = 1155 fps
We don’t need to speculate on the snick-report time. It IS what it IS.
Average loss of speed due to air friction including the wind speed / direction is likely in the 1.7% to 2% over the entire range of 400 to 450 ft for a 55 grain round.
55 grain rounds
Muzzle velocity of 3000 fps x .98 = 2940 fps
d = .2205 / (1/1155 - 1/2940) = 419 ft
With a bullet speed of 3250 fps x .98 = 3185 fps
d = .2205 / (1/1155 - 1/3185) = 400 ft
With a bullet speed of 2800 fps x .98 = 2744 fps
d = .2205 / (1/1155 - 1/2744) = 440 ft
A 77-grain round has somewhat less drag, so the speed could be 2700 fps x .985 = 2660 fps:
d = .2205 / (1/1155 - 1/2660) = 450 ft
Crooks muzzle was 454 ft away.
CONCLUSIONS:
If the rounds were 55 grain bullets then:
THERE WAS A 2nd SHOOTER about 40 feet closer to Trump.
THAT IS EXACTLY THE DISTANCE TO THE FRONT EDGE OF THE BUILDING.
If the rounds were 77 grain bullets then:
Crooks could have been the shooter.
WE NEED TO KNOW WHAT THE BULLETS WERE.
THE FBI KNOWS AND PROBABLY HAS THEM.
WHY ARE THEY HIDING THEM?
IF THE ROUNDS ARE 55 grain, then THERE WAS A 2nd SHOOTER.
P.S. The 2nd and 3rd shots have times of 215ms and 209ms between snick and report. Those would imply correspondingly shorter distances than the ones calculated above by about 2.3% and 5% respectively. That makes it even a further stretch for Crooks to have been the shooter of those rounds.
My first question is: How the observers’ clocks were synchronized?
I guess that was based on audio, so when all they can hear exactly the same speach of Trump. If so, that is wrong. Since the propagation delay of sound.
The distance from loudspeakers should be taken into account.