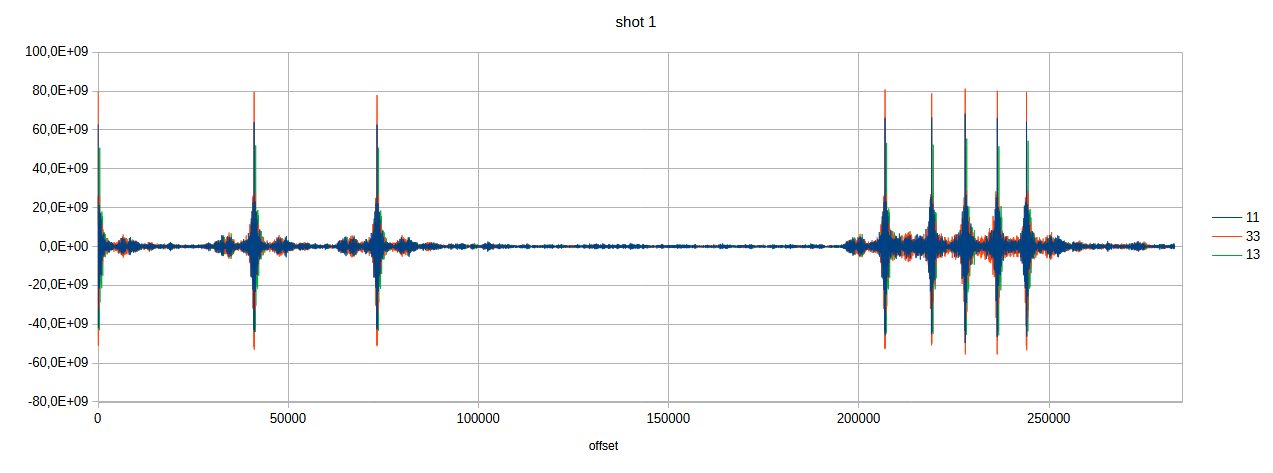
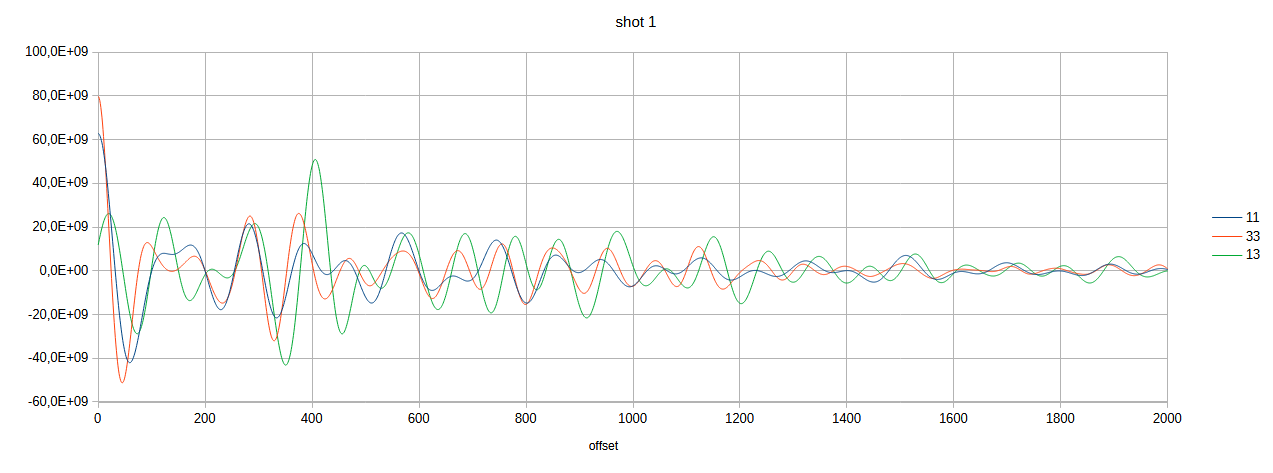
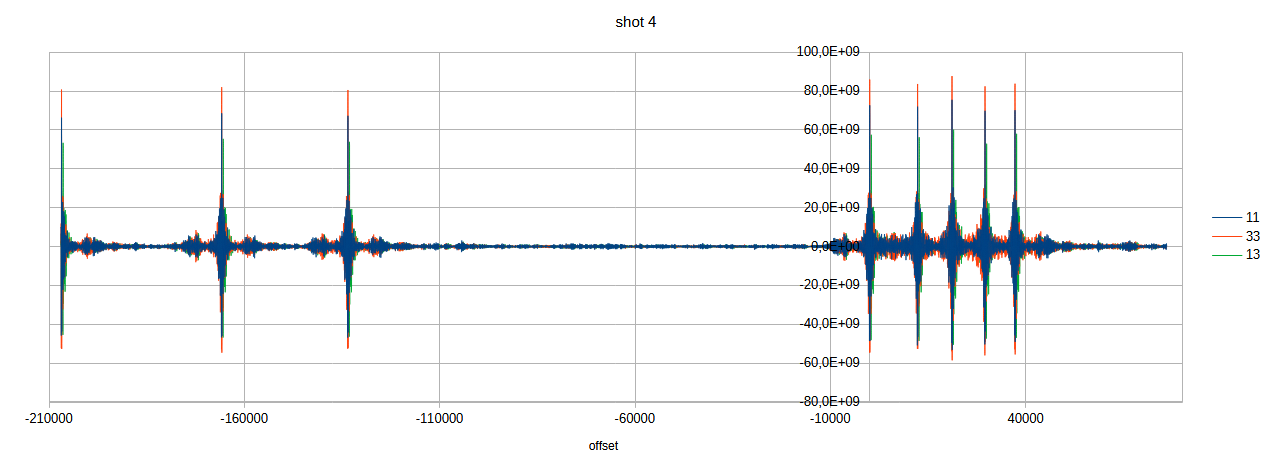
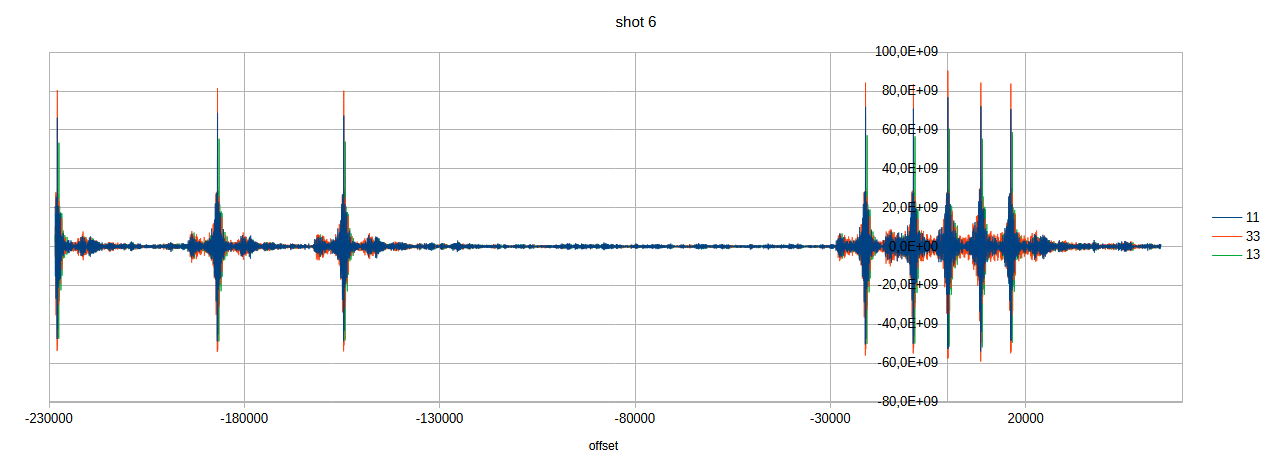
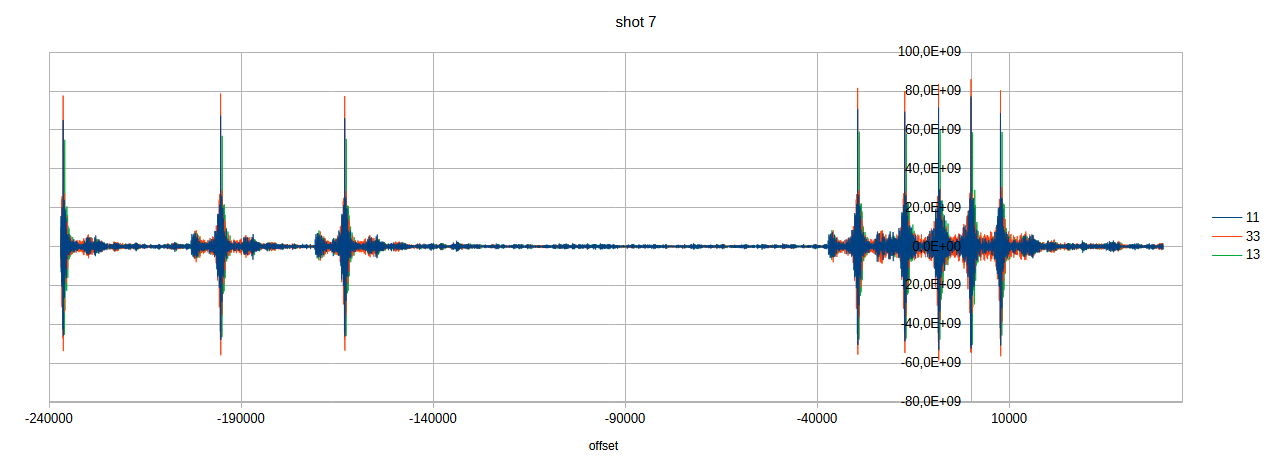
Channel 3 has an offset of +10 ms compared to channel 1, apparently throughout the whole recording. Channel 2 is in between. 500 sampels are about 10 ms. 10 ms equate to about 3.3 m distance between the outer two mics along the car axis, and this is why I smelled a rat rather early – then thinking that channel 1 was recording ambient sound in front of the car. If this is true or not I do not know for sure until today. See my post here and the also the non-discussion with greg_n.
edit: meant for @kincses-zsolt, on the thread level I notice no indication that this was a reply to him immediatly before.
edit: clarified the offset of 10 ms
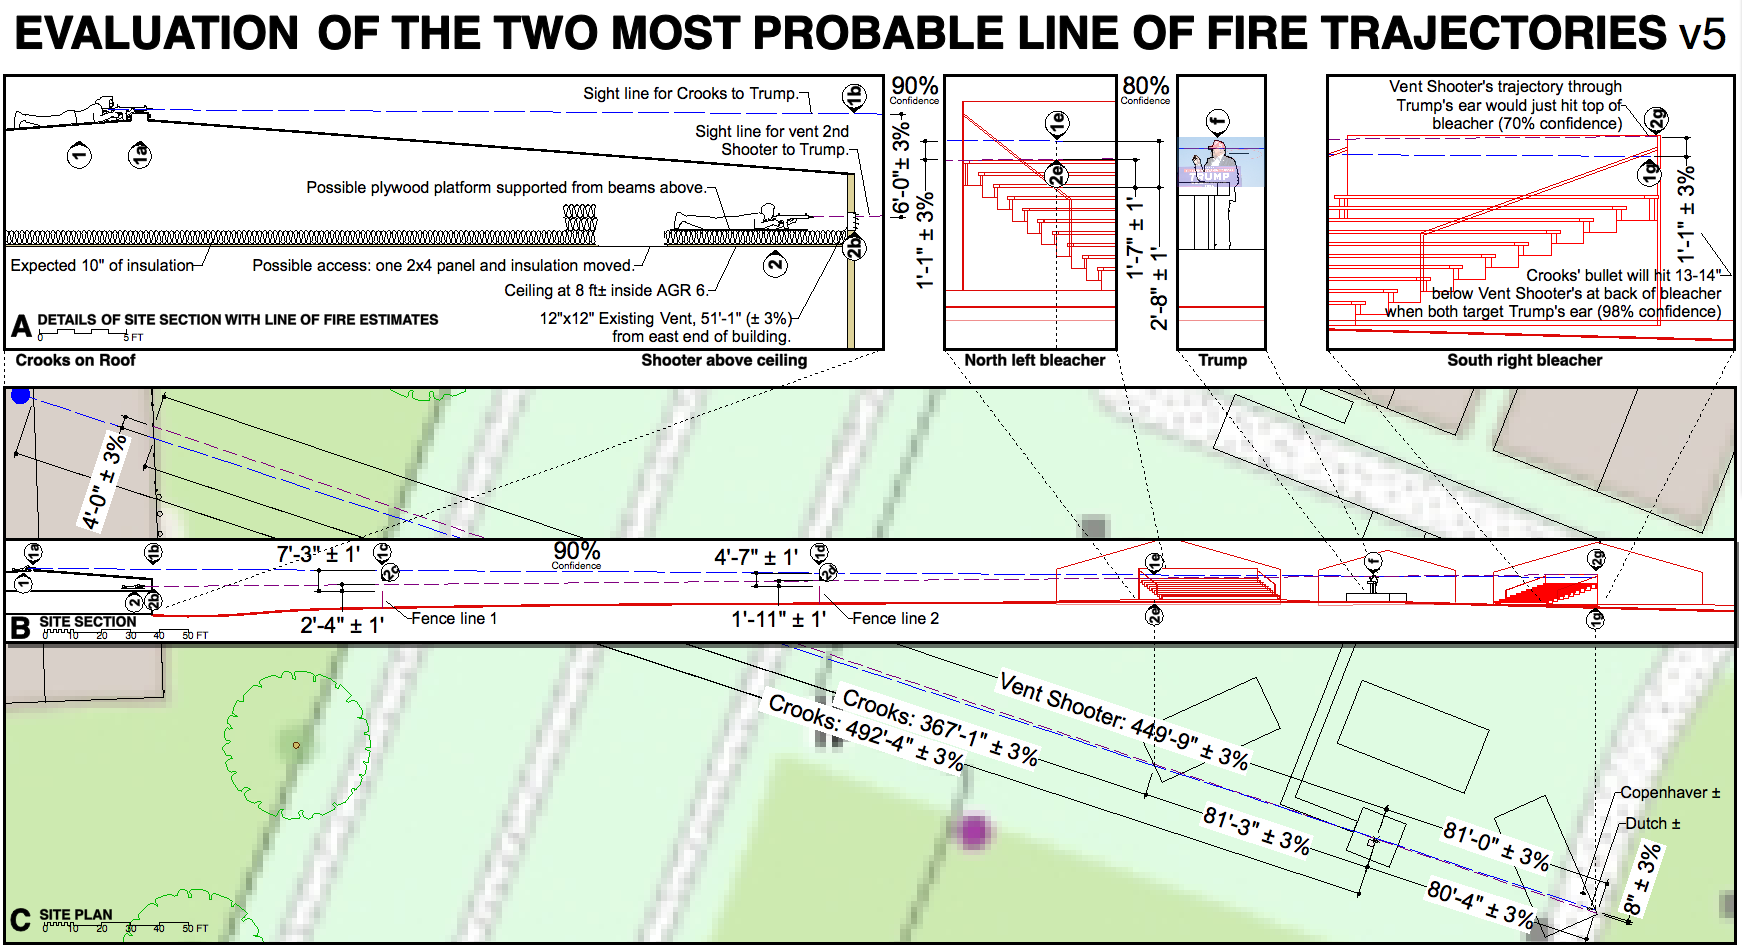
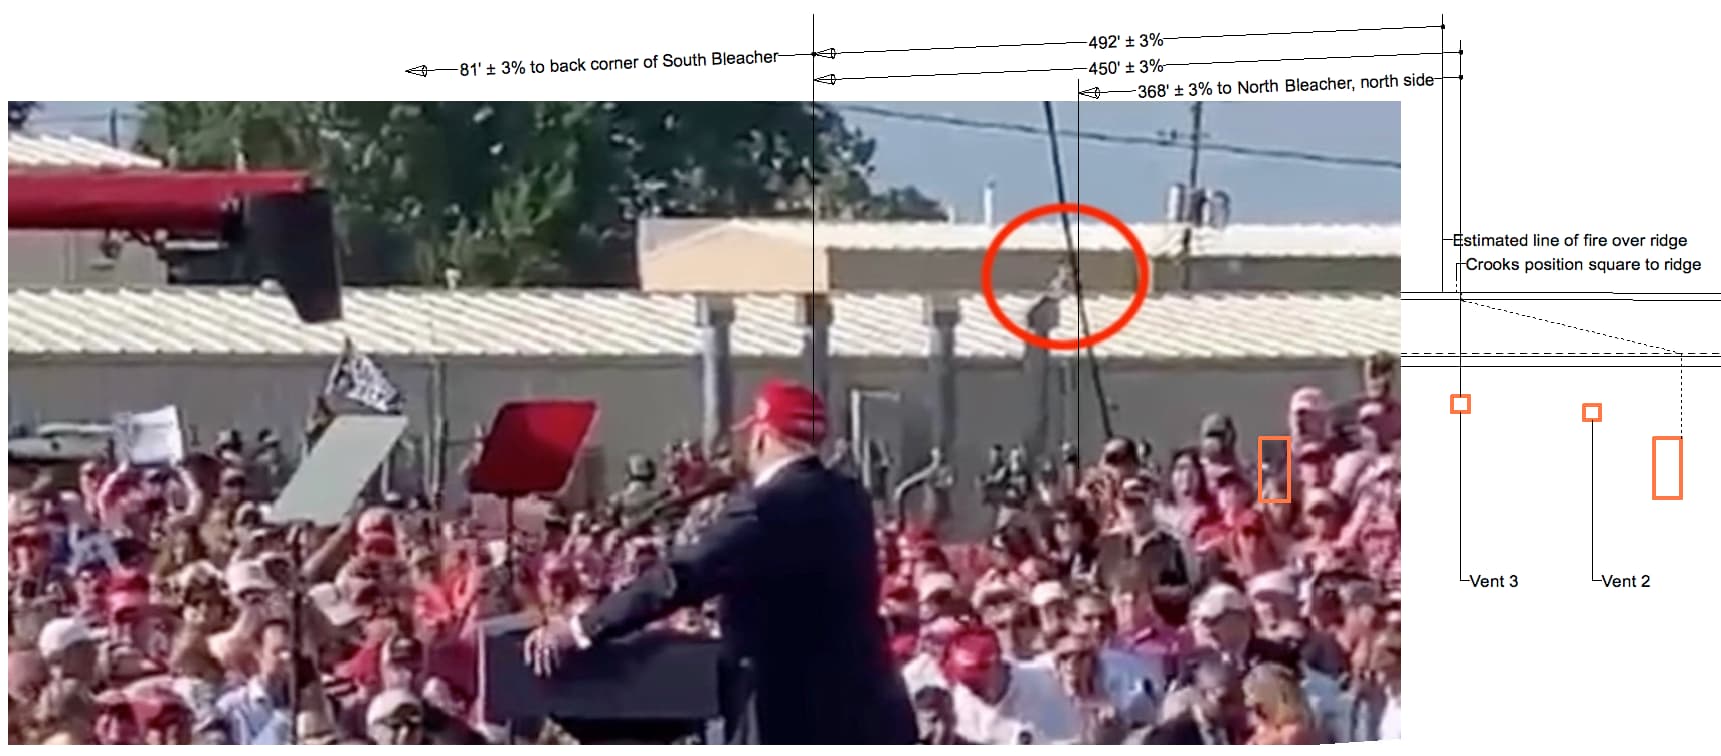
My drawings and source information is different than roger-knight’s thus it can be an independent check from a different source. I believe the data sources I used are crudely approximate and thus I tried to give percentage accuracy and levels of confidence. The plan dimensions I consider the most accurate at +/-3% accuracy. The grade (soil) elevations are the most suspect, which I have given a +/- 1 foot accuracy.
Neglecting the 5-10 ms phase shift for a moment: if all three mics sense sounds within the cabin, wouldn’t their signals be similar? Or what do you mean by micro-shift similarities?
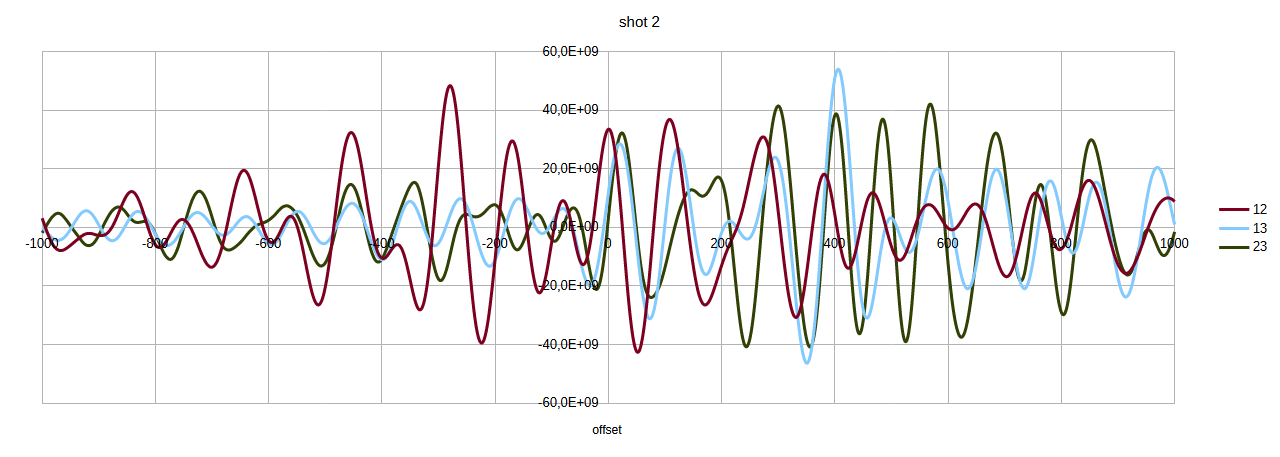
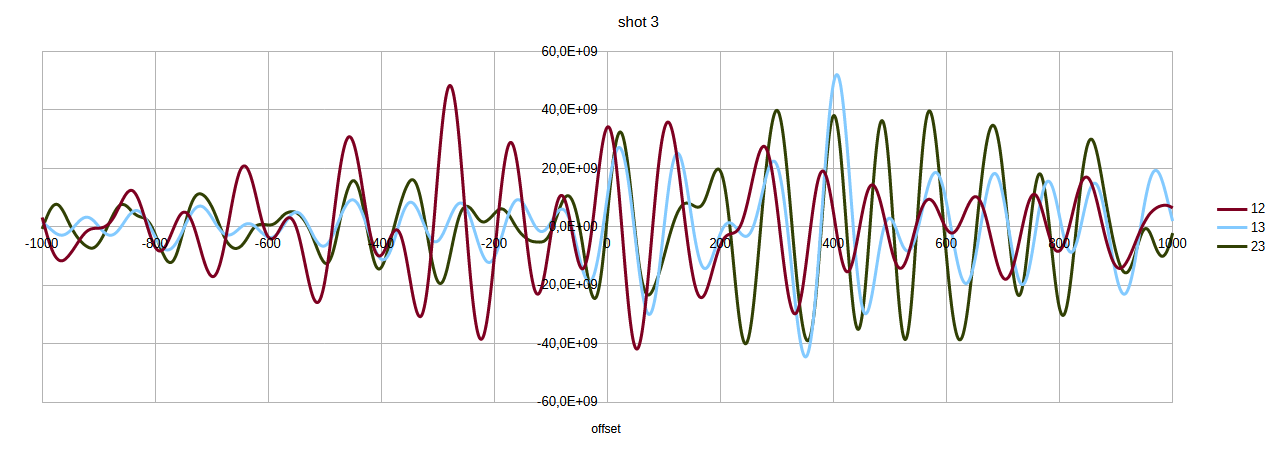
I would expect the channels to correlate well with each other with the correlation peaks precisely indicating the delay between the channels, given the microphones’ proximity. I wish we knew where the microphones are placed in the vehicle.
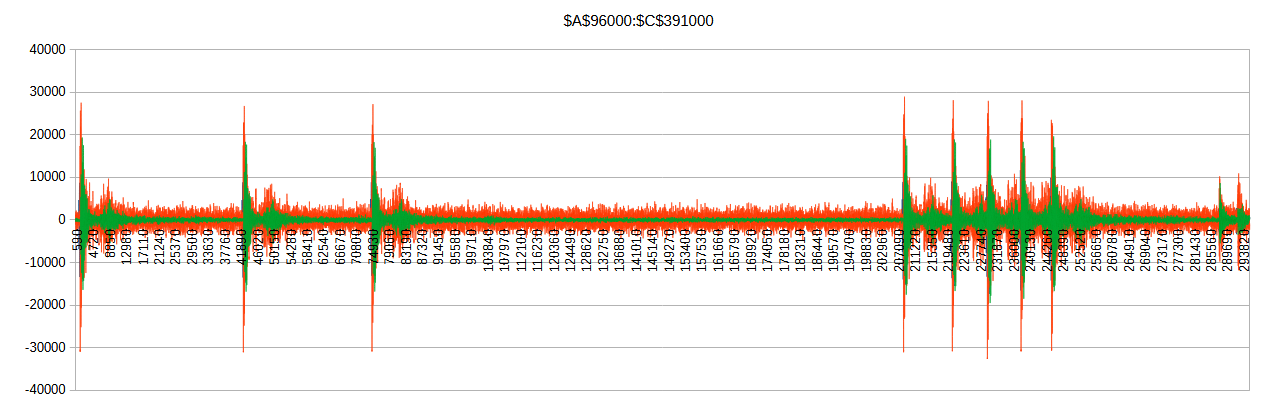
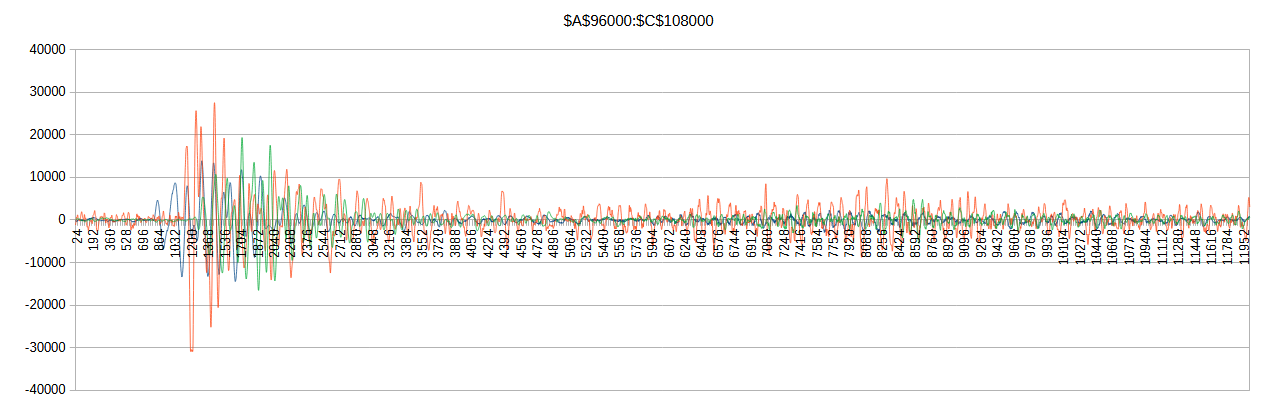
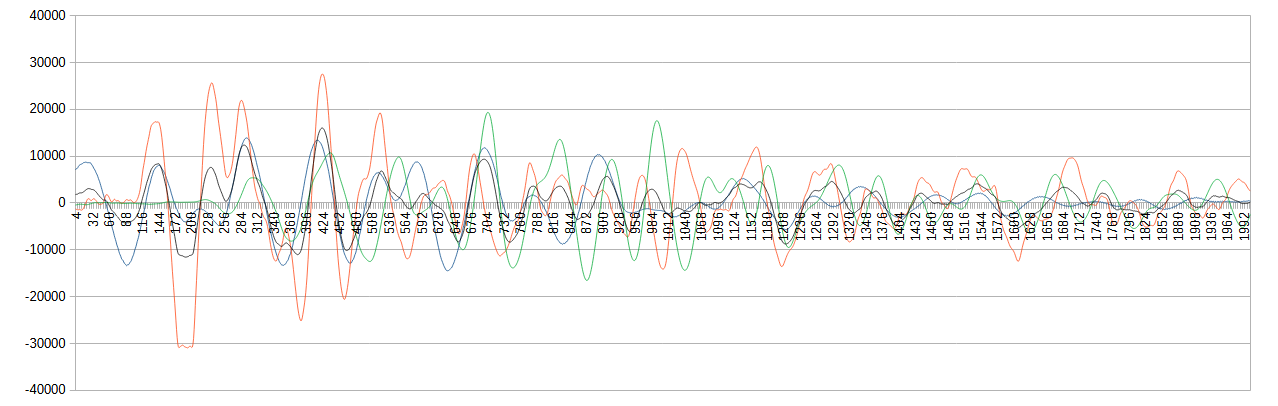
For each channel, I am interested in the sample numbers of all eight peaks when the first shot in that channel is correlated with the other shots in that channel. These correlations should be so accurate that the gaps between the 8 peaks are identical to the sample in each channel. If they aren’t, that is also a red flag because you would at least expect them to get that right if they are simulating all eight shots from a same location. But there are other details they seemed to miss so who knows? Worth a look.
Thank you so much for your efforts and really strange, as if they have been waiting for us? I can’t believe it. Does this confirm that we are on the right track?
Once again, don’t get your self into trouble for these photos, we will work it out in a different way!
Somewhere in this thread @brian60221 posted a flyer of the (?) manufacturer of such a surveillance system tailor-made to police cars. Therein they praised the functionality of a separate channel intended to listen into the potential whispering between unsuspecting suspects on the back seats (which should be the “2nd row” according to greg_n and I don’t think that this patrol car has three seat rows)
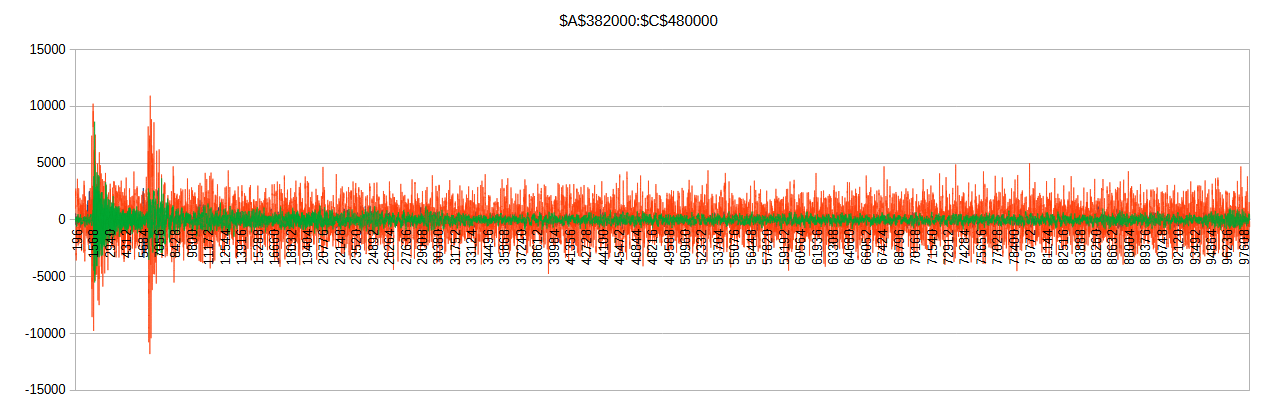
edit: I’m still working, also preparing cross correlation of one channel’s sample with the data sets of the other channels. I’ve solved the resolution problem and underlayed the data points with a grid of ms precision. Soon.
There should only be at most 7 feet, or 6 msec of delay, between the dash and the second row seatrests, assuming the microphones are aligned perfectly longitudinally to the sound source.
Although Ford Explorers have a third row, with it up there isn’t much room behind for gear, so I would think patrol cars keep them down to hold more gear.
Interesting, does anyone know if these Butler city police patrol cars have a tight separation between the front and the back rows similar to the old London-style cabs?
It looks as if a person standing on the left bleachers at the crossing point of the bullet would not be in the way? Maybe it is possible for you to put one person there on the bleachers to see the clearance?
And sorry one improvement suggestion to avoid any misunderstandings. Could you use 2 different colors for the shots, 1 for Crooks and 1 for the 2nd shooter, because if some people don’t study the drawing exactly, it would give the impression that the 2nd shooter misses the corner of the bleachers, which is not the case, it is Crooks that misses that shot!
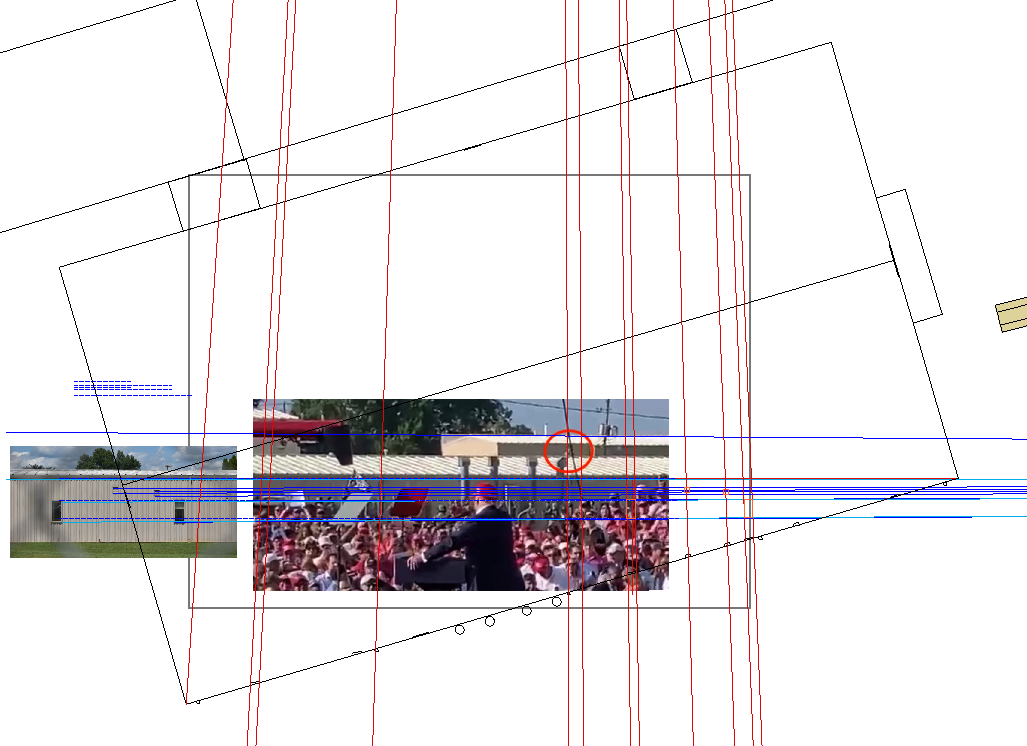
I will try to present the same view as you did with my CAD system, and we can compare the values.
Excellent work. I thought I might contribute my information in my CAD system as a check. First I simply straightened the photo. I did the following photo drawing interface. I projected vent and window locations from vanishing points in the photo.
At about 00:03:07 (18:12:09 according to the clockbar) of the bodycam footage 1302_202407131800_BWC2122104-0RATF.mp4 a man with what can be understood as a MAGA cap is seen standing and probably filming in the direction of AGR Bldg. 6. Someone replied to me that this man was James Copenhaven.
edit: Apparently, there were even two guys filming (the other one standing to the right/North of the first, between the projection of the two cell phone towers)
edit: again no indication that I did reply to @vt1
Excellent work. Regarding whether James Copenhaver was standing or sitting, it doesn’t matter much; both scenarios are instructive. It is unique to have a photo exactly from the target of one of the bullets. Regarding the elevation, you have used the level of his camera (which is presumably eye level), but if he was sitting, that would be approximately two feet lower than when standing, which would be about the level of his abdomen where he was hit when he was standing. So if he was sitting, you have modelled exactly the altitude path of the bullet, and if he was standing, you could subtract a couple of feet to obtain the exact path.
What your model does not include are any of the potential obstacles (visible in Copenhaver’s film). If you did this, you might be able to eliminate with certainty some possible shooter positions.
I’m fairly sure that Trump’s actual on-stage arrival time varies quite a lot from one rally to the next. So, precise timing well in advance would not be possible. The instructions would have needed to be something flexible like, “Okay, as soon as you hear Trump begin to speak, do this …”
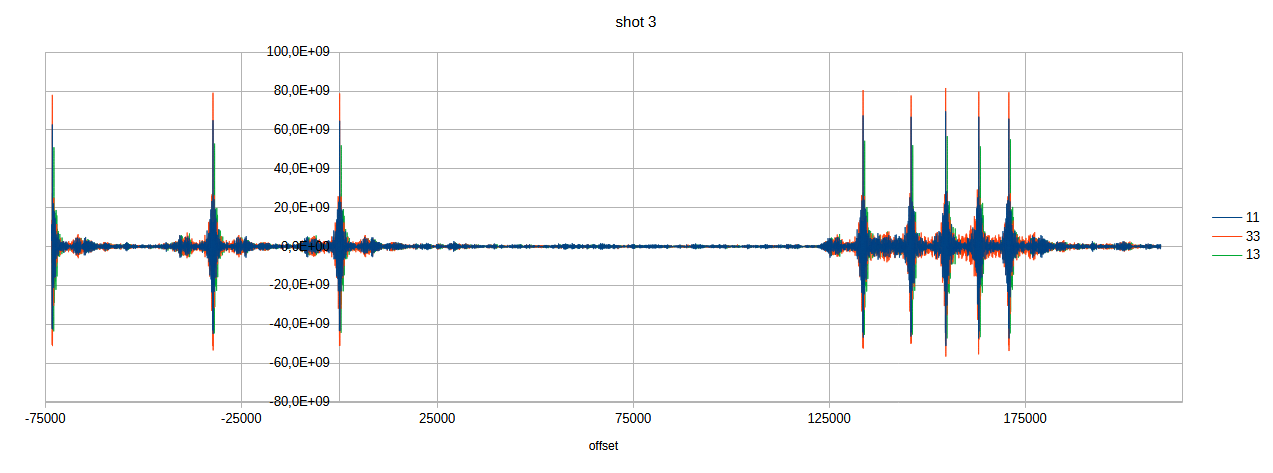
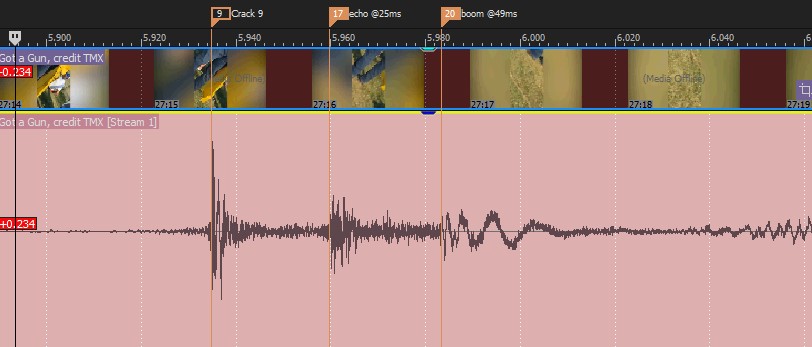
Source 2 (“He’s got a Gun” - Credit TMX) has sufficient quality to allow us to hear the crack-boom times. There is a significant difference between shots 9 & 10. This tells us that the ESU officer on the lawn did not fire shot 10.
I have seen solid plexiglass and screen dividers in patrol cars. But neither are sealed and block sound. That would be bad for the situational awareness of the officer. I think the recording might pick up noises too quiet for the driver to hear.