Audio Analysis Is Most Consistent Two Shooters At Trump Rally

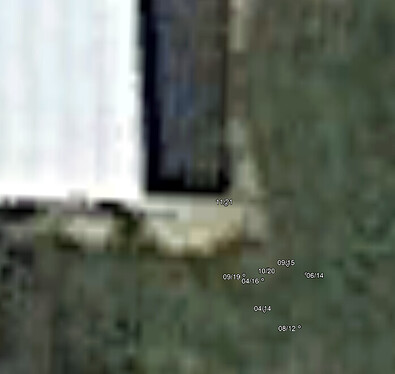
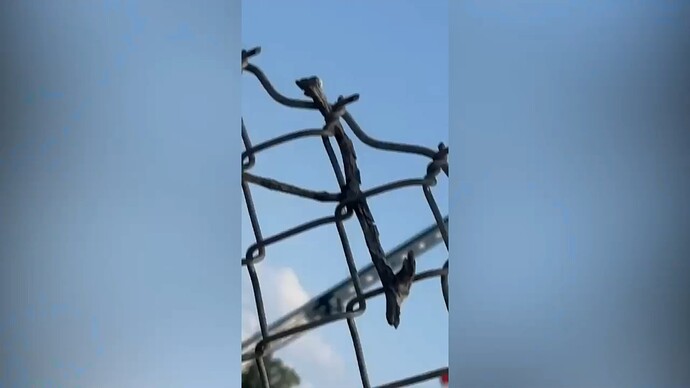
@bumblebeeez as you’re scoping out that fenceline, if you happen to locate this section of fence with the embeded twig and sign post behind it, please let us know the approximate lat/lon

This tells us where the Source 2 recorder was when the first shot was fired.

1 Like

The phase shifts between tracks could be due to some extent to spacing of the mics longitudinally in the cabin; there could also be deterministic delays between the tracks just based on the equipment.

What there should NOT be are random jitter in the shots between the three tracks. Sometimes I am 9 msec delayed, sometimes 10, sometimes 12. This doesn’t agree with any physical model of the shot source(s).

Someone that understood signal processing would not have made this mistake, unless it was done on purpose to be detected.

1 Like

Hi elmanchur,

Welcome to the club.

I assume you are referring to this video:

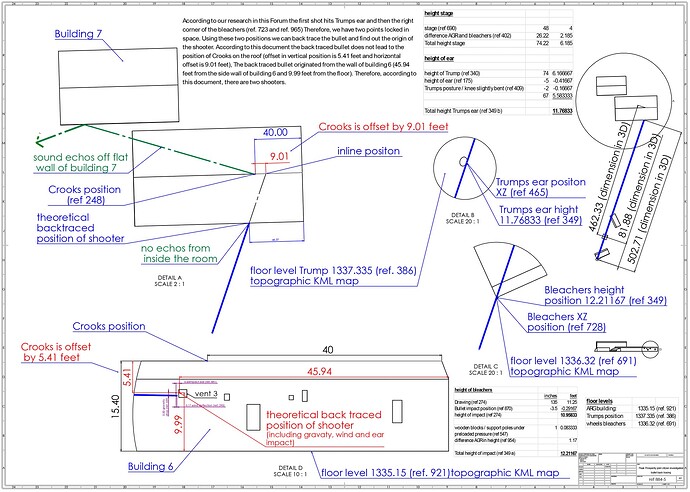
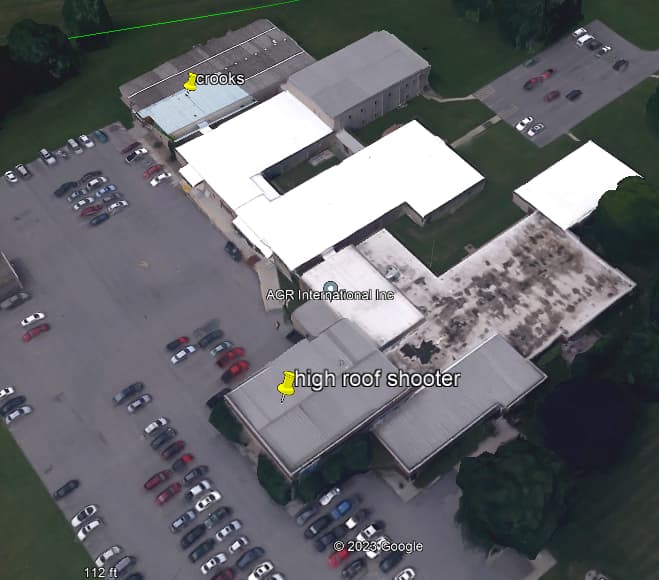
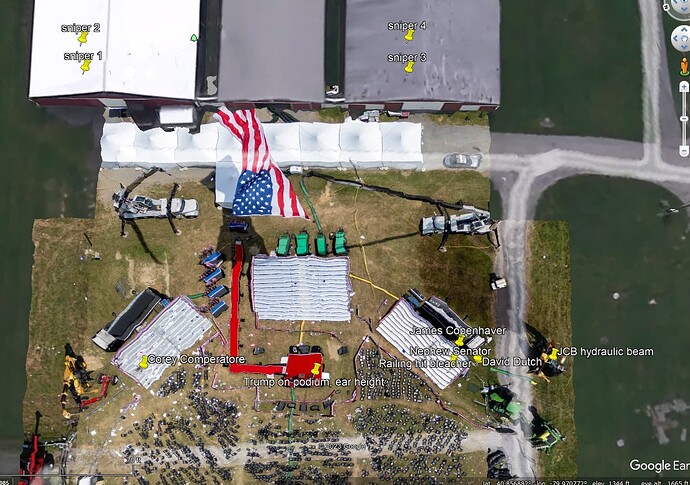
of which I watched with great interest. Please have a look at our drawing below, which is a joint back tracing bullet investigation project here at Peak Prosperity. The fact that the first shot touches Trumps ear and then hits the bleachers corner was a very fortunate event, locking two points in space. With these two points we can back trace the bullet to the original place of the shooter. There are two hypotheses heavily discussed all over the world, one being the official version, that Crooks shot all 8 shots. The second hypothesis is that the first 3 shots came from another place and Crooks shoots 4 – 8. With this project we are back tracing the bullet as described above and if the origine of the shooter leads back to Crooks position, our study would favorize hypothesis 1 (Crooks shoots all 8 shots). However, if the back traced bullet does not lead back to Crooks then hypothesis 2 would be favorized and it would give a hint from where the 2nd shooter was positioned.

I think this YouTube video is a direct reaction to our study to debunk it. This is why it is interesting to analyse this video. I was surprised however how much data we have in common. This is always nice to see, when you calculate something, and somebody finds the same result through a different way. It gives you confidence that our calculations are correct.

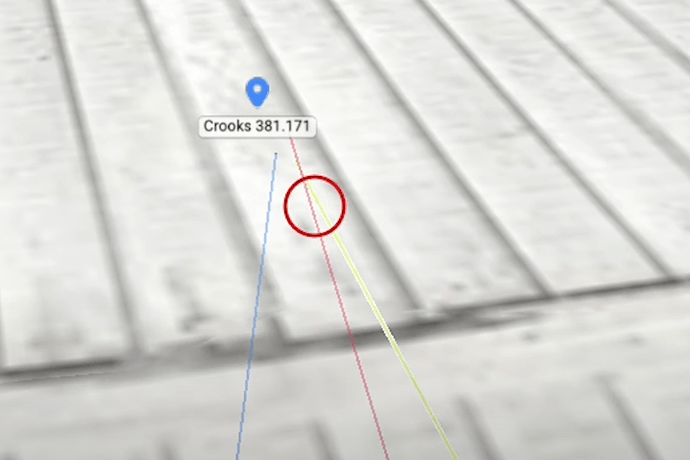
First, I would like to point out that they put the height of Crooks riffle at the position of the body. This is not correct, it shod be pointing on the roof gables:

OK, we can live with this small inaccuracy.

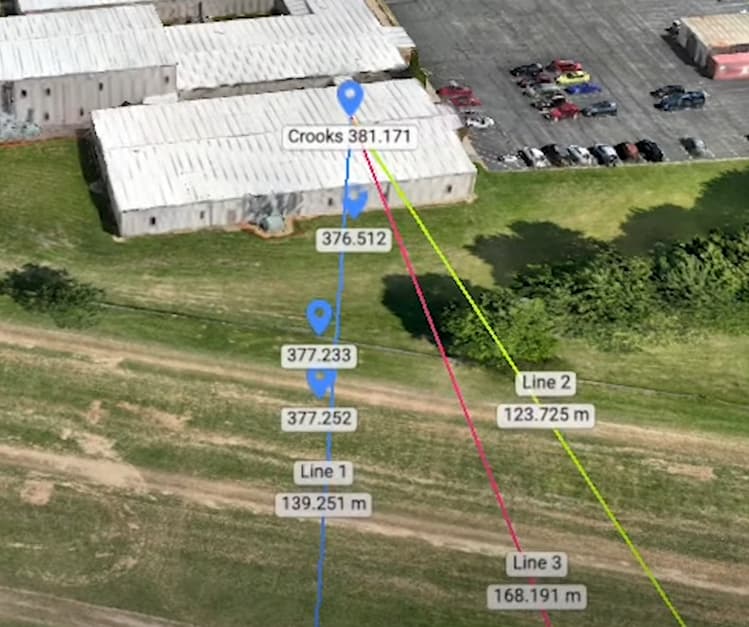
The drone is indicating levels in meters, which is OK, but somehow there is a 100-foot offset. Maybe somebody can explain this offset, but because it is exactly 100 feet, I trust that data from the drone. So, Crooks is at 381.171 and the floor level is at 376.512. This gives us three things we agree: Crooks position on the roof, the height of the building which was calculated in this forum (credit to the guy who drew this drawing) which is 15.5 feet and very important the 376.512 which would indicate with the 100-foot offset to be at approx. 1335. Many people get this wrong, so up to now everything looks legit :wink:

We go on and look at the height of the fence (which we are heavily discussing right now and again we agree, it is 2 feet higher than the level of building 6, namely at 1336.937 feet.

Now comes the part where we fundamentally disagree. The 380.81 is not coming from the drone.
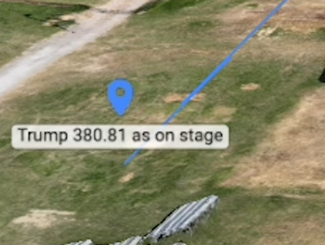
Screenshot 2024-08-23 190715

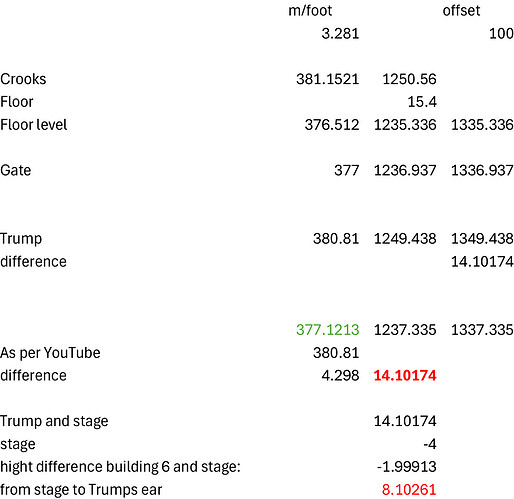
Why did they edit this number. They added their calculation of which we disagree. Assuming the drone gives out the same heights we have been finding, I calculated the number that should be the level of Trump stage, namely 377.1213m (or 1337.335 feet with the 100-foot offset). Gary does mention that the elevation of the terrain at the stage is slightly higher, which I would agree namely approx. 2 feet. So, assuming the drone gives the same elevation as we have, there are very few parameters to justify the height of trumps ear. They claim the absolute height of Trumps ear to be 14.1 feet compared to our calculation which is 11.76. If we deduct the 4-foot stage, it puts Trumps ear from of the stage at 8.1 feet which is impossible.

Let us play with the thought that our calculation is fundamentally wrong, and they got it right. This means the shot from crooks is almost perfectly horizontal. This would give us an impact on the bleachers at approx. 14 feet which again is totally wrong according to our calculation as well. The fact that Gary puts a rough calculation of the stage being 5 feet and Trump being 6.4, I would claim he is stacking tolerances, something he is accusing us of doing :grinning:

Another fact is that the bleachers corner is higher than Trumps ear, which gives us another 2 feet lower in hight. Gary is not even taking the bleachers corner into consideratoin.

I think I could explain why we find a 5.41 foot offset compared to Gary. I am also adding my Excel calculation that should be self explanatory

We would really need that floor level of the stage (of which we assume is at 377.1213 meters from Gary and then they have to show how they calculated the height of the stage and the height of Trumps ear.
2 Likes

So I went back and very carefully measured down to the sample, because before I was just looking at the timings to the millisecond. The maximum jitter between the tracks, once I timed it to the sample, is 270 microseconds.

Still an issue. With these clean, virtually identical waveforms I can easily measure each peak to within about 60 microseconds (3 samples), generally less. A 270 microsecond difference should not be there.

Hi guys. I think we are all speaking apples and oranges here. I will address this to all 3D models (@roger-knight, @howdoiknowthisinfo) and acoustic models (@greg_n) creators.

1- Mercator projection bug: If use a placemark location on Google Earth with Mercator projection (UTM), it will truncate the Latitude and Longitude value after you save the pin. That will offset the position up to 1.4m.

The solution is to use the Decimal Degree on Tools>options and then convert to meters. This way the placemark will maintain accuracy up to 0.11m.

Conversion for this location (not equal to UTM ; This conversion was obtained by measuring 0.01 degree near the location):
Lat(m)= Lat(degree)*11105021
Lon(m) = Lon(degree)*8429686

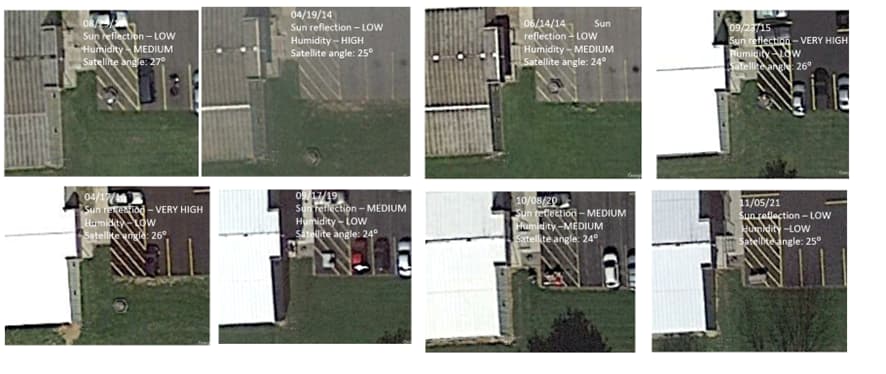
2- Satellite image reference: we have at least 9 images dates. The images have different off-sets to geolocation. Here are the locations of South East lower corner of building 6 for 8 of the satellite images.


The images differ up to 2.5m.

The solution is to pick the best image for everyone to use. Here are the best 8 images. I classified them by Sun reflection (which makes the roof white saturated), Humidity (which makes the image blurry), satellite angle (which distorts the image projection on the ground).

I removed the 5/17/23 because it’s too blurry. For me the best images are 09/23/15, 04/17/16 and 11/05/21 with sharp edges and lines.

The 11/05/21 have less sun reflection. Also, this image has the trees without leaves. with makes a good reference for using the trunk of the trees as reference points. This is the satellite image I’m using.

3- Satellite angle projection error. The satellite has an approximate angle of 25 degrees on image 11/05/21. Measured by the projection of Building 6 height projection of 1.4m and the real dimension of 3m.

This distorts the perception of a position on a higher ground. For example, the real location of Crooks position is 1.86m to the East of his apparent position on the roof, considering his height is around 4m. The same correction applies to the south and north barn snipers. Their real position is 2.6m to the east.

4 - Photo superposition error. For matching of references of the photo on the Google image we must agree to same rules:
4.1- Always disable 3D buildings
4.2- Always use the closest objects on the photo to the point of interest. For example:
At Trump location, I use the light poles as references. In my 3D model I tested 4 images and resulted in an error of 1m on Trump position.

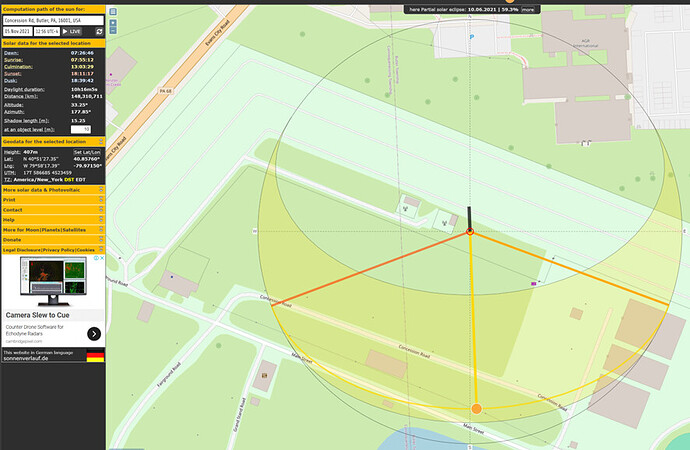
Obs.: Using this site, I found the angle of the shadows on light poles a manage to find the shadow azimuth angle (178.42 degrees) at the exact time of the satellite photo (11/05/21 at 12:58). A 10m object height on this satellite picture (11/05/21) will project a 15.25m shadow.

4 Likes

I think you meant to say “second term” instead of “second factor”. No problem, I’m not a math person either. It would be nice to be able to use the average velocity, but the distance from the path of the bullet to where the recorder is located is important (the off-line distance).

Yes, that’s the simple formula of Tdiff = d/Vc - d/Va, where Va = avg. velocity
That works well when the recorder is not standing off from the path of the bullet. I needed to apply the snick-boom measurements to the Source 2 and Source 6 recorders. So, that’s why the more complex formula was necessary. And for Shot 10, I used the formula with the Podium mic because the report was overwhelmed by the snick (at approximately the t+13 ms point).

Why would you assume “average velocity is 94% of muzzle velocity”? Is this a well established general fact? I tried googling it but didn’t come up with anything. Wouldn’t that factor of 0.94 decrease as the distance from the shooter increased?

which values (lon, lat, alt above sea level and alt above ground) for the following points:

  • Trump’s ear
  • ridge line of the roof of AGR building 6
  • ridge line of the high roof behind crooks, so the highest building at the AGR parking
  • interaction with the bleacher’s railing
  • optional: the impact on the hydraulic line of the JCB hydraulic lift
  • the victims David Dutch, James Copenhaver, Corey Comperatore
  • the snipers 1-2-3-4 on the barn behind Trump
  • optional: a nephew of a congressman (I do not know their names) got injured too. would you happen to have his coordinates too?

I have my version of coordinates for these points of interest, but it would be great if you could share me the values you would use for these…

thanks!

yes, that factor should be variable and depend on the distance/time travelled due to air resistance

as soon as my tool is ready, I will share the bullet’s velocity in terms of the travel time t, ballistic coefficient, etc…

2 Likes

Roger

I wish I could take credit for all of what you reference, but that was not me. I haven’t done any kinds of calculations. I was just commenting on what the drone elevations were according to Gary.

1 Like

I just calculated the ratio from one chart I found. I took the average of the muzzle velocity and velocity at 150 yards, and divided by muzzle velocity. Back of the envelope stuff. I figure if we don’t know the muzzle velocity, and it could be anywhere from 2800 to 3200 fps, rough approximations are going to be good enough.

We thank you for drawing our attention to this video. The reason why I gave you such a detailed answer is because Gary already got 15K views in 1 day, so I am sure somebody is going to call us out on this topic and we will simply be able to point to this answer :wink:

2 Likes

Hi VT,

I understand what you are referring to.

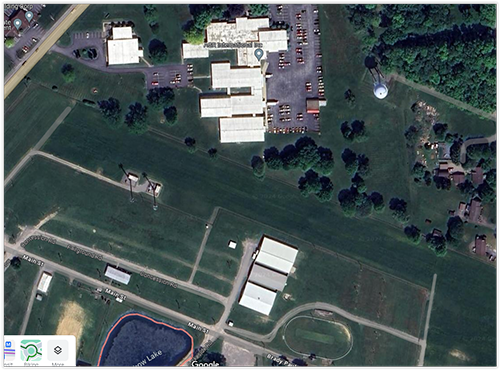
We don’t have a perfect top view photo, especially the total Butler ground. I am using the below picture I got from Google Maps which is a very good basis. Shortly after I posted how to put together the Trump rally footprint and aligning it with the Google Maps dirt paths, 3 days later Google Maps deleted that photo and put one without them. If you don’t believe me go back in history on Google Earth or read this post:

I see you were the one who gave me that tip about the history button in Google Earth :+1:

One idea that came to my mind to solve this problem of the slight top view offsets, would be to ask @rough_country_gypsy again to go out and take a perfectly centered top view of the entire butler grounds. He could use the tall lamps to orient the drone, when the poles are not in sight would mean that he is perfectly “top view”. The higher the better. But not so heigh that rough_country_gypsy loses his drone. :blush:

As you know rough_country_gypsy already gave us the perfect front view of building 6 with his drone of which we are all so grateful for. Once again thank you gypsy!

Or a perfect top view from building 6, a perfect top view from the middle grounds and a perfect top view from the stage position. Maybe somebody could then help us put together a very accurate top view reference basis to work with.

Screen Shot 07-23-24 at 12.02 PM 001-red

1 Like

Average can mean almost anything, if we know only the first and last number (numerical value).

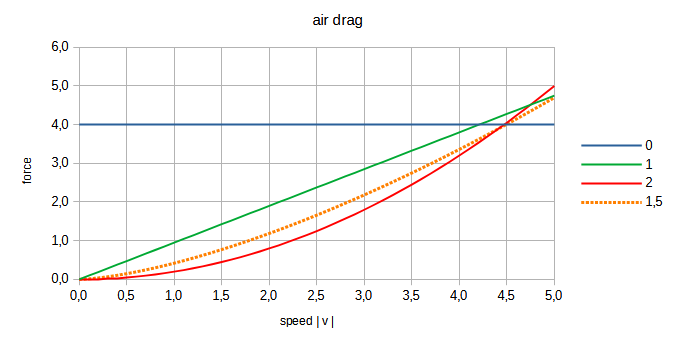
Simplified text books say the force due to air drag is proportional to either the first or second power of the speed. But this is because ‘we’ can solve that simplified differential equation. (‘we’=there is someone) The reality is (1) something in between, (2) may change with velocity, (3) depend on the ‘overall’ shape and the microscopic shape of the flying object (e.g. coarse graining surface or polished mirror).
air drag

Additional problem that the dimension must be the same at both sides of equation. One side is force, other side is speed at fractional power. What the hell is going on? This problem violates our principles. Annoying.
(However, Caltec professor Carroll had mentioned a strange thing called emergence. I guess it is some sort of it. But that leads to a weird mathematical problem. I have to look for its name. Traditionally you manipulate the two sides of eq. in same way, e.g. you add 5 to both sides etc.)

The nerd is partially awakened. I got to wondering where that third term came from (I don’t remember caring about whether they are called terms or factors; but “factor” is used when you have values multiplied together). Anyway, after trying to find it on the internet and staring at right triangles, I went back to calculus principles and I think I got it figured out.

IF you assume the bullet velocity is constant, solving for the time the “snick” sound takes to get to a recording device is a fairly straightforward second semester calculus problem. You draw a diagram assuming the recording device will pick up the snick the bullet made just BEFORE it came to the closest point to the recording device. So you are dividing the distance the bullet travels, b, into two pieces, b-q and q. When the bullet has traveled distance b-q, its shockwave starts its travel to the microphone.

So I took the first derivative of the travel time with respect to the distance
q. Then I set that first derivative to 0, solved for q, and then found the total time, after many scratched out mistakes. It does match your equation.

The problem is, this method only works if the bullet velocity is constant. As it is, you would just about have to do it numerically, which isn’t that hard these days. However, when I put in sample values of speed of sound = 1150 fps, bullet velocity = 3000 fps and h = 50 feet, that third term (or factor) of the equation is less than one millisecond. Might as well ignore that third term and use the average velocity of the bullet for the second term, considering we don’t even know the actual speed of the bullets.

3 Likes

I could do it once, but that’s part of the 80% of the math that I’ve almost completely forgotten. Unlike the calculus exercise I just did, I don’t even have the desire to try to resurrect that knowledge.

1 Like

An EU agency blocked me too at the .st site for supposed copyright infringement by Sci-Hub. That could mean that EU already has the Great Firewall in place, just like the evil Chinese. It will get interesting if they soon also block NIH/Pubmed content… You can still get the above cited article here.

2 Likes

thanks for the link!

yes, that firewall is in place already…

many sites in the US and the UK are not accessible from the EU countries “due to copyright infringements” and other censorship related claims…

1 Like

Since sci-hub.st and sci-hub.se are fully blocked, the blocking could still be explained by DNS manipulation. And it is: if I use the google nameserver 8.8.8.8, sci-hub.se and .st are freely accessible and hence the EU still simply forces the telco providers to falsify DNS entries.

I can access both. Interesting, there is also sci-hub.ru
sci-hub
I cannot recognize the next one is chinese or japanese.

Sonja, here are three posts from earlier in this thread where @vt1 explains how the formula was derived and simplified:
401 447 451

You are correct that that velocity is not being modeled perfectly. Ideally, I would prefer to have a more complex equation where I could use the muzzle velocity and ballistic coefficient published by the ammunition manufacturer to compute a more precise snick-boom time. If someone would like to derive that or has seen it published in a paper, I would be happy to implement that in the model.

True, but even small changes can make a difference when working with these velocities and geometries. For example, consider shot 10 being recorded by the podium mic. We can’t hear the boom for that, so it needed to be calculated. If I use all three terms, I get 13.4 ms for the snick-boom difference. If I ignore the third term, I get 10.4. That’s quite significant. Milliseconds matter. My computation for Shot 10 was way off until I incorporated those small differences.

1 Like